
Now that the RIPE NCC has reached its last /8, some Local Internet Registries (LIRs) are choosing to obtain additional address space from other organisations via the emerging transfer market. Here we examine statistics from the last two and a half years of transfers and visualise per country aggregates on a map.
In RIPE NCC Membership - Developments after Reaching the Last /8 we noted how the RIPE NCC membership continued to show strong growth rates after reaching the last /8 of IPv4 space in 2012. Under the present policy every LIR, whether existing or new, can obtain one final /22 IPv4 allocation. When an LIR still needs more globally unique IPv4 address space, the only route is to try to find another LIR that is willing to part with some of its no longer needed addresses via resource transfer.
In the RIPE NCC service region we distinguish three categories of resource transfers:
- Transfers via merger or acquisition: when an organisation (or part of it) is sold, the Internet number resources in use by its network can be transferred. This is subject to certain rules and procedures.
- Transfer of legacy resources: organisations who received address space before the start of the R egional Internet Registry system system can transfer this to others on their own terms and conditions. When registry services are required, the RIPE NCC Services for Legacy Internet Resource Holders policy applies.
-
Transfer of resources allocated or assigned by the RIPE NCC
or otherwise through the RIR system:
these transfers are governed by policies developed by the RIPE community.
This article focuses on transfers in the last category. Because all the associated changes in registration are handled by the RIPE NCC, we have a complete view of this part of the market. The full record of all IPv4 transfers, Provider Independent (PI) and Provider Aggregatable (PA), registered in this third category is published on the relevant tables on the RIPE NCC's website.
Between 17 October 2012 and 1 May 2015 a total of 2,252 unique address blocks have been transferred. In this context, a 'block' is a contiguous range of IP addresses which may or may not correspond to a single CIDR prefix. Figure 1a shows the distribution over time, i.e. the number of transfers per month.

In the last six - nine months, the transfer market seems to have gained momentum, with the number of transfers increasing rapidly. However, a look at the transfer table reveals that, especially in recent months, many transfers on a given date are between the same parties. In these cases, the recipient's need quite likely could not be met by a single transfer from the originating LIR. Instead, multiple smaller blocks were transferred, to reach to the required size. Figure 1b shows the distribution of such transactions as a function of time. We still see a rise in IPv4 transfer activity, but it is a more gradual rise, not as steep as in the monthly counts of individually transferred blocks.
Summing up all transfers, we find a total of 14,526,720 IPv4 addresses, equivalent to 86.6% of a /8, changed hands between 17 October 2012 and 1 May 2015. The monthly distribution is shown in Figure 2. It peaks in November 2014 with almost two million IPv4 addresses transferred. August, October and December 2014 were also quite strong with on average 1.25 million IPv4 addresses transferred. In the subsequent months of January 2015 through to April 2015, levels of transfer were significantly lower. Because the RIPE NCC listing service continues to show strong demand, the lower amounts transferred may well be a sign that the market in the RIPE region is capped by availability; total demand cannot be met by available supplies. This may change after the recently accepted RIPE policy for inter-RIR transfers has been implemented. It opens up at least the possibility for organisations in other regions to transfer no longer needed IPv4 addresses to LIRs in the RIPE NCC service region.

Figure 2: Distribution of transferred number of IPv4 addresses
Turning to the size of transferred blocks, Figure 3a shows how, on the level of single transfers, relatively small blocks dominate the transfers; 80% of them are between a /24 and a /20, i.e. ranging from 256 to 4,096 addresses. In terms of transactions (the combined transfers between same parties on the same date) the smaller sizes, especially /23s and /24s, are less ubiquitous (see Figure 3b). This demonstrates that most parties are not in the market for a single /23 or /24; such small sized blocks are more often part of a transaction that fills the need for a larger block. Transactions larger than a /18 (16,384 addresses) while less common, account for most of the addresses moving between LIRs: the top 10% largest transactions involved about 72% of all transferred address space.

Transfers from the last /8
As a special case, we looked into transfers from 185/8, the last /8 allocated to the RIPE NCC by the IANA. In 2011, the RIPE community adopted a policy which aims to preserve a last bit of IPv4 space for new entrants in the next five to ten years. Every existing and new LIR can receive one last /22 allocation from this last /8 (which includes any other fragments of IPv4 address space that were reclaimed, returned or otherwise came back to the RIPE NCC free pool). The expectation was that LIRs who requested the /22 would use it in their own networks. However, as the table of transfers demonstrates, this is not always the case. We find an increasing number of transfers involving /22s from 185/8.
Like the general transfers, activity in transfers from the last /8 picked up in the last nine months. Figure 4a shows the distribution of transfers of /22 blocks from 185/8 over time; we can see a rising trend with with clear peaks in December 2014 and April 2015. Figure 4b shows the age of the /22 allocation at time of transfer. It illustrates how the majority of transfers from 185/8 involve blocks which are less than six months old at time of transfer.

Figure 4a and 4b.Time and Age distributions of transfers from 185/8
Because it is felt that transferring final /22s within a few months after allocation is in conflict with the intention of the last /8 policy, members of the RIPE community drafted a policy proposal which aims to stop this behaviour. Under the proposed policy, transfers of /22s from the last /8 would only be allowed when at least 24 months have passed since allocation. With the first Discussion Phase completed, the policy proposal will soon move to the Comment and Review Phase.
Putting it on a map
To get some insight on how the IPv4 transfer activity is spread over the RIPE NCC service region we aggregated the statistics by country. For each transfer, we determined the originating and receiving country by locating the transferred block in the RIPE NCC delegation statistics archive before and after the date of transfer. For each country, the transfers fall into one of three categories:
- Import: the transferred block originates in a different country
- Export: the transferred block is destined for another country
- Domestic: the transferred block stays within the country
The sum of all three yields what one can call "market size", a measure for the amount of addresses changing hands.
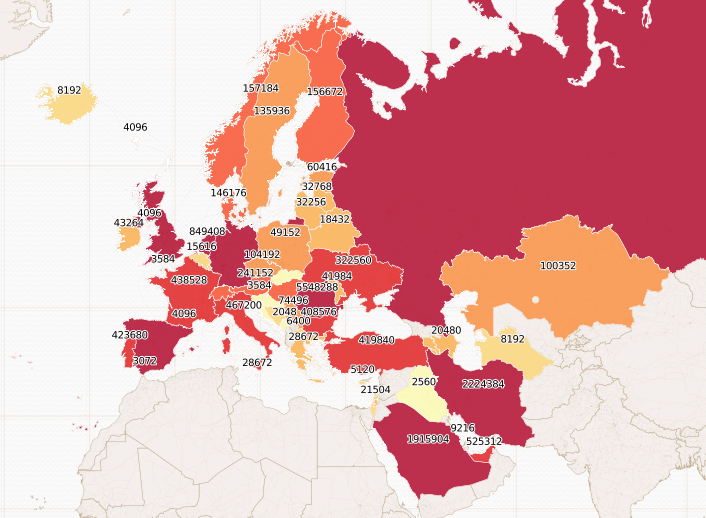
The results are shown on a map in the visualisation below, made with help of CartoDB . In this map countries are colour-coded based on their transfer market size. The exact values are displayed on top of each country. When hovering over the map with the mouse pointer, a popup displays which shows the number of IPv4 addressed imported, exported and transferred domestically for each country. Clicking pops up a window which, in addition to these statistics, shows the number of transfers in each category.
The map does show a few countries outside our service region with transfer activity. These are not signs of inter-RIR transfers, but transfers which involved RIPE NCC LIRs with a legal base overseas. The transferred IP addresses themselves are still used in the RIPE NCC service region.
Putting the data on a map immediately reveals the hot and cold spots in transfer activity. Table 1 below provides the details for the top ten by market size.
| Country | Imports |
Imported IPv4 |
Exports |
Exported IPv4 |
Domestic Transfers |
Domestic IPv4 |
Market Size |
| RO | 17 | 45312 | 699 | 4944384 | 480 | 558592 | 5548288 |
| DE | 49 | 242688 | 44 | 965120 | 75 | 1191936 | 2399744 |
| IR | 197 | 1453056 | 2 | 1280 | 44 | 770048 | 2224384 |
| SA | 31 | 1904640 | 6 | 6144 | 2 | 5120 | 1915904 |
| RU | 14 | 178688 | 97 | 473344 | 194 | 972288 | 1624320 |
| GB | 162 | 241920 | 27 | 66560 | 81 | 1265152 | 1573632 |
| NL | 53 | 416000 | 14 | 377856 | 36 | 55552 | 849408 |
| ES | 48 | 499456 | 15 | 53248 | 23 | 50176 | 602880 |
| AE | 6 | 525312 | 0 | 0 | 0 | 0 | 525312 |
| IT | 35 | 178176 | 4 | 9216 | 24 | 279808 | 467200 |
| Table 1: Top ten countries by Transfer Market Size |
Romania leads the way with 5.5 million IPv4 addresses transferred, 90 percent of which are exported. Germany has the second largest market, followed by Iran, Saudi Arabia and Russia. However, while in Germany and Russia demand is satisfied largely by domestic transfers, Iran and Saudi Arabia rely heavily on import. Exports from these two countries are minimal. For the United Arab Emirates exports are non-existent; the country did not see any domestic transfers either. In terms of number of transferred blocks, Romania also takes the lead; in this metric the country is not only big in exports but has a strong position in domestic transfers too.
Top recipients and originators
A look at the transfer tables , which per RIPE community policy include full names of transferring and receiving parties, shows several organisations are involved in multiple transactions. They transferred or received IPv4 space on multiple occasions. To get an idea of trends, which organisations are releasing IPv4 space and which organisations acquire space, we aggregate all (PI and PA) transfers by receiving and originating party. Table 2 lists the top ten recipients in terms of total address space.
| Organisation | Transferred IP addresses |
| Saudi Telecom Company JSC | 1616896 |
| British Sky Broadcasting Limited | 1048576 |
| Mobile Communication Company of Iran PLC | 999424 |
| Vodafone GmbH | 786432 |
| Emirates Telecommunications Corporation | 524288 |
| Vodafone Telecel, Comunicacoes Pessoais, SA | 393216 |
| Iran Telecommunication Company PJS | 327680 |
| VODAFONE ESPANA S.A.U. | 327680 |
| Superonline Iletisim Hizmetleri A.S. | 290816 |
| Digital Ocean, Inc. | 282624 |
| Table 2: Top ten recipients, ordered by total size of transfers |
Organisations in the Middle East have a strong presence in this top ten. Saudi Telecom Company secured via multiple transactions most addresses (a bit more than the equivalent of a /12 plus a /13). However, as shown above on the map, this is not the only region where IPv4 is still in demand. The top ten recipients list shows branches of the Vodafone group as well as relatively young Digital Ocean Inc. also obtained good amounts of IPv4 addresses via transfers.
In terms of number of transactions, we find a rather different top ten. Table 3 shows Saudi Telecom Company still holds the top position, but Mobile Communcation Company of Iran drops to the seventh position. The other organisations in this top ten did conclude a relatively high number of transactions but the amount of IP addresses obtained is only small to medium sized. Fast Serv Inc. stands out as the organisation with the smallest block size per transfer. All 20 blocks, obtained in 14 transactions, were a size /24 in size. XT Global Networks, Asociata Interlan and Proper Support hold the most fragmented address space obtained via transfers. Each had more than 100 unique IP blocks transferred to their account in just 10 to 15 transactions.
| Organisation | Transactions | IP Blocks | IP Adresses |
| Saudi Telecom Company JSC | 16 | 31 | 1616896 |
| Asociatia Interlan | 15 | 113 | 55808 |
| Fast Serv Inc. | 14 | 20 | 5120 |
| XT GLOBAL NETWORKS LTD. | 12 | 123 | 168704 |
| Asiatech Data Transfer Inc. PLC | 11 | 12 | 192512 |
| Proper Support LLP | 11 | 106 | 56832 |
| Mobile Communication Company of Iran PLC | 10 | 16 | 999424 |
| TENNET TELECOM SRL | 10 | 45 | 45824 |
| marbis GmbH | 9 | 26 | 36352 |
| NeckarCom Telekommunikation GmbH | 9 | 9 | 10240 |
| Table 3: Top ten organisations receiving transfers, ordered by number of transactions |
Looking at organisations which originate IPv4 transfers, we find six organisations from Romania in the top ten ordered by total amount transferred (see Table 4). Jump management SRL are the top supplier, but German QSC AG is a good second.
When we order the parties originating transfers by the number of completed transactions (table 5), Jump Management is again number one with a record number of 146 transactions involving 832 IPv4 blocks. Affiliate Jump Internet Services is a good second with 69 transactions, 207 blocks. Together these two organisations account for almost 20% of the transactions concluded between October 2012 and 1 May 2015. The average size of the transactions is modest, only a bit more than the equivalent of a /19. In this top ten QuickSoft LLC and Bulgakov Aleksey Yurievich stand apart, as both transfer significantly fewer IPv4 addresses in a similar number of transactions than the organisations immediately above and below them. The average per individual transfer is 1,024 addresses, i.e. the size of a /22.
| Organisation | Transferred IP addresses |
| Jump Management SRL | 1294848 |
| QSC AG | 1179648 |
| Telefonica UK Limited | 917504 |
| S.C. GVM SISTEM 2003 S.R.L. | 777216 |
| AdNet Telecom Services SRL | 589824 |
| EUROLAN SOLUTIONS SRL | 589824 |
| GOSTARESH-E-ERTEBATAT-E MABNA COMPANY (Private Joint Stock) | 491520 |
| VisNetwork Media S.R.L. | 403968 |
| Jump Internet Services SRL | 363264 |
| Wu Han YunWaiHeng information Technology, Co,Ltd. | 344064 |
| Table 4: Top ten originators, ordered by total size of transfers |
| Organisation | Transactions | IP Blocks | IP Adresses |
| Jump Management SRL | 146 | 832 | 1294848 |
| Jump Internet Services SRL | 69 | 207 | 363264 |
| Ltd Elekom | 40 | 41 | 123904 |
| Petersburg Internet Network ltd. | 23 | 23 | 135168 |
| QuickSoft LLC | 18 | 24 | 24576 |
| Marcel Edler trading as Optimate-Server | 15 | 32 | 146944 |
| S.C. GVM SISTEM 2003 S.R.L. | 15 | 16 | 777216 |
| Bulgakov Aleksey Yurievich | 14 | 24 | 24576 |
| Transit Telecom LLC | 13 | 13 | 123904 |
| OOO "NPO Relcom" | 11 | 20 | 129024 |
| Mailbox Internet Ltd | 11 | 12 | 24576 |
| Table 5: Top ten organisations originating transfers, ordered by number of transactions |
Conclusion
IPv4 transfers in the RIPE NCC service region have picked up in the last nine months; a market is emerging as several countries and organisations are still in need of IPv4. Putting aggregated per country level transfer data on a map immediately shows where the action is. We find modestly sized blocks to be in high demand; Romanian Jump Management and Jump Internet Services are top caterers to that market (although need is often filled with multiple smaller blocks per transaction). Large transactions happen less frequently, but do account for the bulk of the address space transferred. The irregularity of the large transfers also makes it hard to asses where the market is headed. In terms of monthly transferred addresses, 2015 thus far does not show a clear direction. It will be interesting to see if this changes later in the year, once the RIPE community policy for inter-RIR transfers has been implemented by the RIPE NCC.
Comments 8
The comments section is closed for articles published more than a year ago. If you'd like to inform us of any issues, please contact us.
Catrangiu Marius •
it's very interesting to see the profits that these companies made out of this transactions (but not limited to) http://www.romanian-companies.eu/jump-management-srl-26028773/ http://www.romanian-companies.eu/gvm-sistem-2003-srl-15117956/ these info's are not so accurate but may be true.
Tore •
Interesting subject, you should go more deeply, i am thinking at profits behind every large LIR ?
w •
So as to keep low profile to have Lu Heng’s IPs sold. He had created another shell named Wuhan Yunwaiheng Information Technology Co., Ltd registered in Wuhan, Hubei Province of China ( its Chinese name is:武汉云外恒信息技术有限公司). And then have his IPs sold under this new shell without attracting too much attentions from the RIPE community. He has earned more than 4millions USD for selling his IPs. By the way, cos of this business structure, he can avoid heaps of taxes which should be paid to Netherland Gov and Overseas Gov. Rijksuniversiteit Groningen ( this is where Lu heng graduated) 31.201.0.0/16 2011-04-28 PA SOLD AS35916 (US) 37.222.0.0/15 PA SOLD AS16276 (ovh, France) ;AS35916 46.136.0.0/16 PA SOLD AS8312(kpn Netherland);AS35916 5.132.0.0/16 2012-07-12 PA ( Split for sales) /17 left for future sale AS35916 5.224.0.0/15 2012-09-06 SOLD AS35916 178.236.224.0/20 PA Still available for Sale AS16276 Lu Heng still has /17 +/20 left available for Sale in RIPE and one aggregated Afrinic 154.80.0.0/12 ( Currently in Rental business).
Tore Anderson •
The pop-up says Norway has imported 4096 addresses, but that is far from correct; on the 2nd of May 2013, Altibox AS transferred a /15 from QSC AG (a German country). This is visible at https://www.ripe.net/manage-ips-and-asns/resource-transfers-and-mergers/ipv4-transfers/table-of-transfers. Tore (not the author of the previous comment, btw)
Rene Wilhelm •
Thanks for pointing that out Tore. The error has its origins in the delegated statistics files. In the days immediately following the transfer, 92.220.0.0/15 was listed with country code DE. See for example ftp://ftp.ripe.net/pub/stats/ripencc/2013/delegated-ripencc-20130503.bz2 . It only changed to NO about a month later. The methodology used in this analysis thus classified it as a domestic transfer, the /15 was believed to have stayed in Germany.
W •
The Business structure of OutsideHeaven: The main Body of OutsideHeaven was registered in Tax heaven place ( Netherland). Then come the lower Body OutsideHeaven Hangzhou ( registered in Zhejiang Province of China) and the other lower Body Wuhan Yunwaiheng Information Technology ( registered in Hubei Province of China). Under this kind of structure, the company of Lu Heng has avoided to pay the taxes he should pay to the Chinese Government. His main Body registration info: His shell company’s registration info written in holland language. However, you can use google translate to understand. Please note this company does not pay any tax in Holland and in China. Online inzage uittreksel KvK-nummer 01133738 Deze inschrijving valt onder beheer van Kamer van Koophandel Noord-Nederland Onderneming Handelsnamen OutsideHeaven AnytimeChinese Voor Altijd Rechtsvorm Eenmanszaak Startdatum onderneming 26-06-2008 Activiteiten SBI-code: 620102 - Ontwikkelen en produceren van maatwerksoftware SBI-code: 6203 - Beheer van computerfaciliteiten Werkzame personen 0 Vestiging Vestigingsnummer 000005125421 Handelsnamen OutsideHeaven AnytimeChinese Voor Altijd Bezoekadres Esdoornlaan 656, 9741MH Groningen Telefoonnummer 0641734323 Internetadressen www.anytimechinese.com www.anytimechinese.net E-mailadres info@anytimechinese.com Datum vestiging 26-06-2008 Activiteiten SBI-code: 620102 - Ontwikkelen en produceren van maatwerksoftware SBI-code: 6203 - Beheer van computerfaciliteiten Webdesign. Het exploiteren van een informatieve website. Het geven van informatie over China aan ondernemers. De export van online gamecards. Het beheren van computernetwerken. ICT dienstverlening. Beheren van ICT infrastructuur. Werkzame personen 0 Eigenaar Naam Lu, Heng Geboortedatum en -plaats 01-09-1988, Onbekend, China Adres Esdoornlaan 656, 9741MH Groningen Datum in functie 26-06-2008 One of His Chinese Dummy Corporation named 杭州云外恒网络技术有限公司 in Chinese/English name: outside heaven If you look at its websites, there is no update since 2013 http://www.outsideheaven.com/zh-cn/news You can search the company registration info via link http://122.224.75.235:7082/wsdjpt/ The other of his Chinese Dummy Corporation named Wuhan Yunwaiheng Information Technology Co., Ltd registered in Wuhan, Hubei Province of China ( its Chinese name is:武汉云外恒信息技术有限公司) You can search the company registration info via link http://gssoso.whhd.gov.cn/dhb/index.html Ironically, a Clever Chinese guy without “Euro blood” can be "smart Enough" to have as many RIPE IPs as he can.
Peter •
The statistics from the lab are not accurate, because the legacy transfer has not been taken into account. For Example, the transfer of 8 /16s from Credit Suisse Group to Softlayer B.V. dated on 2014-06-23 The transaction price is around 4,194,304 US dollars. THE TRANSFERRED LEGACY BLOCKS 159.8.0.0/16 SOFTLAYER-RIPE-4-8 159.122.0.0/16 SOFTLAYER-RIPE-4-9 161.202.0.0/16 SOFTLAYER-RIPE-4-10 168.1.0.0/16 SOFTLAYER-RIPE-4-11 169.53.0.0/16 SOFTLAYER-RIPE-4-12 169.54.0.0/16 SOFTLAYER-RIPE-4-13 169.55.0.0/16 SOFTLAYER-RIPE-4-14 169.57.0.0/16 SOFTLAYER-RIPE-4-15 RESOURCE SOFTLAYER APPLIES FROM RIPE NCC 159.253.128.0 - 159.253.159.255 185.10.228.0 - 185.10.231.255 37.58.64.0 - 37.58.127.255 46.16.184.0 - 46.16.191.255 5.10.64.0 - 5.10.127.255 5.153.0.0 - 5.153.63.255 81.95.144.0 - 81.95.159.255 2a00:1668::/32 2a03:8180::/32 137.34.0.0 - 137.34.255.255/16 158.216.0.0 - 158.216.255.255/16 159.156.0.0 - 159.156.255.255/16 162.26.0.0 - 162.26.255.255/16 166.8.0.0 - 166.15.255.255/13 167.168.0.0 - 167.168.255.255/16 169.32.0.0 - 169.52.255.255(/12+/14) 169.56.0.0 - 169.56.255.255/16 169.58.0.0 - 169.63.255.255(/14+/15) 193.202.46.0 - 193.202.61.255/20 194.242.51.0 - 194.242.51.255/24 195.129.39.0 - 195.129.39.255/24 198.133.140.0 - 198.133.140.255/24 198.135.137.0 - 198.135.137.255/24 198.135.138.0 - 198.135.138.255/24 198.147.160.0 - 198.147.160.255/24 198.148.177.0 - 198.148.177.255/24 198.148.178.0 - 198.148.178.255/24 198.206.197.0 - 198.206.197.255/24 198.206.200.0 - 198.206.202.255(/23+/24) 198.240.128.0 - 198.240.128.255/24 198.240.128.0 - 198.240.130.255(/23+/24) 198.240.128.0 - 198.240.255.255/17 198.240.129.0 - 198.240.129.255/24 198.240.130.0 - 198.240.130.255/24 198.240.131.0 - 198.240.131.255/24 198.240.131.0 - 198.240.255.255 198.240.133.0 - 198.240.133.255/24 198.240.141.0 - 198.240.141.255/24 198.240.146.0 - 198.240.146.255/24 198.240.202.0 - 198.240.202.255/24 198.240.212.0 - 198.240.215.255/24 198.99.148.0 - 198.99.148.255/24 198.99.222.0 - 198.99.222.255/24 199.43.246.0 - 199.43.247.255/23 199.53.0.0 - 199.53.255.255/16 199.91.16.0 - 199.91.31.255/20
Rene Wilhelm •
In response to Tore Anderson's comment above we have updated, both the map and the entry for Germany in Table 1. For Norway the increase of 131,072 additionally imported IPv4 addresses translates to an almost doubling of their market size. For Germany the shift from domestic transfers to exports concerns about 5% of the IPv4 addresses transferred by organisations in that country.