
Ahead of RIPE 72, we wanted to take another look at our membership statistics. Was membership growth affected by the Executive Board's resolution preventing multiple LIR accounts? And how will the growth in new LIRs affect the projected lifespan of the available IPv4 pool?
Membership developments
On 18 November 2015, the RIPE NCC Executive Board adopted a resolution to temporarily restrict the ability of RIPE NCC members to open additional LIR accounts. The Board resolution immediately followed the RIPE NCC General Meeting alongside RIPE 71 , where RIPE NCC members raised concerns about the growing number of organisations opening additional accounts and subsequently obtaining multiple /22s from the last /8 . Almost six months later, we look at how this has affected the rates at which new LIRs are being created.
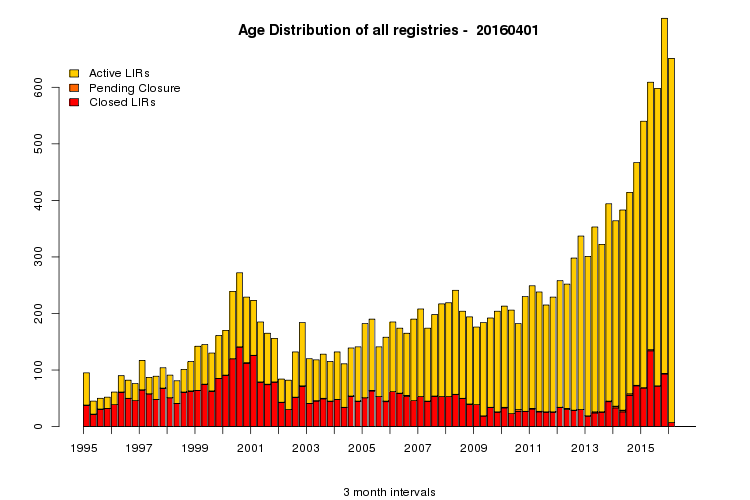
In Figure 1 you can see the age distribution of past and present LIRs. Each bar in the graph shows the total number of LIRs who joined the RIPE NCC in each quarter from 1 January 1995 to 1 April 2016. Inside each bar the red part indicates how many of the LIRs that joined in that quarter have closed by now. Note that the red bars don't show when the LIRs closed. Instead, they show when the LIRs which today have the status "closed" originally joined the RIPE NCC.
Looking at the 20-year history, we see how for a long time it was the third quarter of the year 2000, at the height of the dotcom bubble, that held the record for the largest number of LIRs signing up in a single quarter. However, since the third quarter of 2012 (when the RIPE NCC reached the last /8 of IPv4), the rate at which new LIRs are being created has been accelerating. Every quarter or every other quarter shows a new all-time high in the number of new LIRs signing a Standard Service Agreement. The first quarter of 2016 is no exception: the number of 652 new LIRs may be lower than the record set in the last quarter of 2015, but it is still significantly higher than the number of LIRs who joined in any quarter before October 2015. Even with the restriction on opening additional LIRs in place, growth has remained strong.

Figure 1: Distribution of LIRs by date of signing RIPE NCC Standard Service Agreement
Another thing to note is that very few LIRs that signed up in the first quarter of 2016 have closed by now. This is a striking difference with last year, when a significant number of LIRs closed in the same quarter that they had opened. This could be an effect of the Executive Board's resolution on multiple LIRs, but it could also be that some organisations are working around the resolution by creating separate legal entities to hold these new LIRs and are in no hurry to close them. Two possible reasons are:
- A policy change proposed early in 2015 and accepted in July forbids the transfer of the final /22s within 24 months of receiving the allocation from the RIPE NCC.
- During their 98th meeting , the RIPE NCC Executive Board passed the resolution "that LIRs which close within 12 months have to pay the full annual fee before commencement of a merger/transfer/closure procedure of their LIR account.”
So those LIRs that opened for the sole purpose of acquiring some additional IPv4 space have no financial incentive to close early in that same year.
IPv4 depletion
The rate at which new LIRs are opened is important when it comes to the question how long the RIPE NCC's pool of IPv4 addresses will last. In September 2012, the pool first dropped to the level of one /8. This activated section 5.1 of the RIPE community's IPv4 policy , which allows both new and established LIRs to request one final /22 IPv4 allocation. With, at the time, 8,500 established LIRs and over 16,000 /22s available, it was clear that full depletion would depend on new members joining the RIPE NCC.
As a reminder, the RIPE NCC's pool of available and reserved IPv4 addresses has four components:
- Available and reserved addresses in 185/8, the last /8 received from IANA
- Addresses allocated to the RIPE NCC from the IANA recovered pool
- Addresses outside 185/8, deregistered by the RIPE NCC (e.g., when an LIR closes for non-payment of fees)
- Addresses reserved for special purposes (a /13 for temporary assignments, a /16 for allocations to IXPs and a /16 for unforeseen circumstances)
To estimate the lifetime of the remaining IPv4 pool, we have to consider both the rate at which IP addresses leave the pool and the rate at which they are returned.
The consumption side of the equation is determined by LIRs requesting their final /22. Figure 2a shows the evolution of allocated addresses from 185/8 between September 2012 and May 2016. The blue data points show the growth in total allocated space, while the green and red points show the allocations related to the age of the LIR. Address space allocated to new LIRs that joined after the RIPE NCC reached the last /8 is shown in green and address space allocated to older, established LIRs is shown in red. We can see that right after activating the last /8 policy, established LIRs dominated the allocations; members that could still use an additional 1,024 IPv4 addresses came to the RIPE NCC for their final allocation. In the following years, the new LIRs took over and since 2014 the roles have reversed. Today, most of the allocations made from 185/8 go to new LIRs.
Figure 2b shows this behaviour more clearly by plotting the first derivative, the amounts of IPv4 address space allocated to old and new LIRs on a weekly basis. Although the variations from week to week are large, the long term trends are clear: more and more new LIRs receive a /22 allocation while at the same time fewer of the older LIRs request the final /22 that they are still entitled to. In 2015, and in the first four months of 2016, the combination of these opposing trends resulted in what to first approximation is linear growth. The blue line in Figure 2a illustrates this: it represents the best fit to the last 12 months of data, yielding an average consumption of 9,200 IPv4 addresses per day.

Figures 2a and 2b: IPv4 allocations to old and new LIRs from September 2012 to May 2016
On the receiving side of the equation, we have two sources of IPv4 addresses to replenish the available pool: allocations from IANA's recovered pool and addresses recovered by the RIPE NCC (e.g., when an LIR is closed). The evolution over time of the total amount of addresses coming back from these sources is shown in Figure 3a. By May 2016, the combination of these two sources had brought about eight million recovered IPv4 addresses back to the RIPE NCC's available pool. However, the graph also makes it clear that these sources are drying up - the rates in 2014 were much higher than they were in the last 12 months.
The IANA recovered pool was finite to start with; it was the globally-accepted allocation policy which made it so that the addresses were distributed to RIRs in a sequence of smaller and smaller half-yearly allocations. After the last allocation in March 2016, only 162,048 addresses are left in IANA's recovered pool. Divided between the five RIRs, that leaves 32,409 addresses that are still to be allocated by IANA to the RIPE NCC over the next few years. At the RIPE NCC's present allocation rate, this will last just four days.
The address blocks recovered by the RIPE NCC itself were for a large part deregistered while implementing the policy " Contractual Requirements for Provider Independent Resource Holders in the RIPE NCC Service Region ". As described in the implementation details , when the RIPE NCC did not receive any response from the End User, resources were deregistered. Resources were also deregistered when LIRs were closed, for instance for non-payment of their membership fees. In Figure 3b you can see the changes on a weekly basis. It is clear that variations have become smaller and smaller. Averaged over the past 40 weeks, IPv4 addresses were deregistered at a rate of about 1,000 addresses a day.

Figures 3a and 3b: Evolution of recovered IPv4 space between September 2012 and May 2016
Excluding the reservations for temporary assignments and unforeseen circumstances, the RIPE NCC available and reserved pools contained 15,518,536 addresses on 1 May 2016. Taking linear growth as first order approximation, the present consumption rate of 9,200 IPv4 addresses per day and the recent return rate of 1,000 addresses per day leaves a net depletion rate of 8,200 IPv4 addresses per day. Under unchanged circumstances it would take 2.4 years for the remainder of 185/8 to be allocated and another 2.8 years, until July 2021, before the RIPE NCC allocates the last available IPv4 addresses to an LIR.
Note that these projections do come with large uncertainties. Five years is a long time in the world of the Internet. It is unlikely that conditions remain unchanged over this time. The rate at which new LIRs are created could change drastically in the years to come. However, it should be clear that it is consumption - IPv4 allocations
from
the pool to (predominantly) new LIRs - that is the main driver. Significant contributions
to
the pool, from recovered address space held by IANA or deregistered addresses by the RIPE NCC, can no longer be expected.
Comments 0
The comments section is closed for articles published more than a year ago. If you'd like to inform us of any issues, please contact us.