
With only a few months left until the fifth anniversary of RIPE NCC reaching the last unallocated /8 of IPv4 space, we look at developments in transfers in, to and from the RIPE NCC service region.
As requested by the RIPE community, we publish raw statistics on transfers conducted via the transfer policies. These statistics include the transfer of allocated PA, assigned PI as well as inter-RIR transfers. Transfers of legacy resources within the RIPE Registry are not included, as the details of these are not necessarily shared with the RIPE NCC. A recent policy proposal tries to change this situation by requiring the RIPE NCC to publish statistics on changes to legacy resources in the RIPE Database.
To get a sense of the long term trend in IPv4 transfers, we calculated the cumulative amount of addresses transferred as a function of time; i.e. for each date, we determined the total amount of address space transferred up to that date. Figure 1 shows the result, split by intra and inter-RIR transfers.

The graph shows how transfers in the RIPE NCC service region surged in 2014. The market began to stabilise over the next year and from October 2015 onward growth has, to first approximation, been linear. Excluding the one-off jump in October 2016, caused by the transfer of almost one million addresses from PlusNet plc. to British Telecommunications PLC on 5 October 2016, the average transfer rate in the last one and a half years comes down to 17,000 IPv4 addresses per day, as indicated by the red trend line. The total number of IPv4 addresses transferred until 1 June 2017 is 30.5 million.
Transfers with networks in other RIR service regions became possible after the implementation of an inter-RIR transfer policy on 30 September 2015. In the 20 months since, some 4.9 million IPv4 addresses have been transferred under the policy. Around 300,000 addresses left the region, while a further 4.6 million were added to the RIPE Registry from other RIR service regions. With the exception of a single transfer of 2.1 million addresses from ARIN to the RIPE NCC on 28 December 2015, the long term trend here is also more or less linear. However, when we compare the number of addresses changing holder in a single transfer, inter-RIR transfers tend to be larger, as illustrated in Figure 2.
| Figure 2: Distribution of transfer sizes, translated to prefix lengths. Transfers with non-integer lengths correspond to cases where the total number of IP addresses transferred is not a power of two; this happens when a single transfer involves multiple differently-sized blocks. |
Transfers by Country
To look at this at a country level, we mapped the individual transfers to flows between or inside countries using allocation and assignment statistics published by the RIRs on a daily basis. For each IP address block and AS Number delegated by the RIRs to their members, these statistics list the ISO3166 code of the country where the organisation holding the resource is located. Usually this is where the resources are used, but there are exceptions, most notably with international organisations. Still, looking up country codes in this archive right before and immediately after the date of a transfer is the best approximation for mapping transfers to countries, as it can take time for more precise information to propagate to the databases of IP geolocation providers.
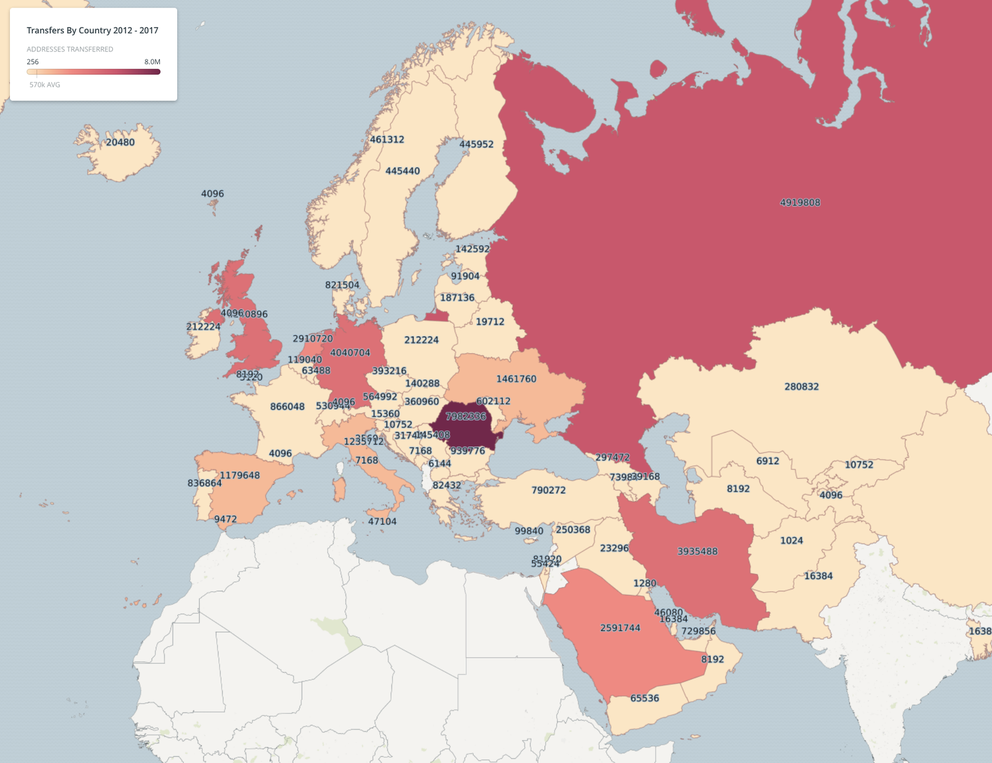
Figure 1 shows the aggregates of all transfers in the RIPE NCC transfer statistics (both intra and inter-RIR) on a map. For each country the number represents the total amount of IPv4 addresses transferred to, from or within the country. The colour scheme groups countries into seven buckets, based on the total number of addresses transferred.
![]()
Figure 3: Total transfers per country in the period October 2012 - June 2017
We can see how most countries fall into the smallest bucket with less than one million IPv4 addresses changing holder. Six out of 76 countries in the RIPE NCC service region have not engaged in transfers at all, while only ten countries have transferred more than a million addresses. Together these ten countries account for 75% of all transfers related to the RIPE NCC service region (transfers within the region as well as inter-RIR transfers to or from the region). Romania stands out as number one, with close to eight million IP addresses transferred before 1 June 2017. Table 1 below lists the details for the top countries conducting transfers in, to or from the RIPE NCC service region. Transfers are split into three categories: imports, exports and domestic transfers (where the transfer is between parties in the same country).
| Country | Imports | Imported Addresses | Exports | Exported Addresses | Domestic Transfers | Domestic Addresses | Total Transferred |
|---|---|---|---|---|---|---|---|
| Romania | 35 | 215,040 | 1,459 | 6,686,720 | 1,250 | 1,081,600 | 7,983,360 |
| Russian Federation | 71 | 279,040 | 348 | 1,455,616 | 914 | 3,224,320 | 4,958,976 |
| United States | 64 | 286,464 | 124 | 1,738,752 | 18 | 2,621,952 | 4,647,168 |
| United Kingdom | 356 | 565,760 | 108 | 1,079,040 | 223 | 2,601,728 | 4,246,528 |
| Germany | 165 | 927,488 | 157 | 1,503,232 | 213 | 1,619,200 | 4,049,920 |
| Iran | 345 | 2,478,336 | 6 | 5,632 | 119 | 1,451,520 | 3,935,488 |
| Netherlands | 239 | 1,688,576 | 84 | 581,120 | 150 | 644,096 | 2,913,792 |
| Saudi Arabia | 43 | 2,578,432 | 6 | 6,144 | 3 | 7,168 | 2,591,744 |
| Ukraine | 20 | 44,544 | 79 | 563,456 | 192 | 897,280 | 1,505,280 |
| Italy | 115 | 575,744 | 21 | 227,328 | 61 | 438,272 | 1,241,344 |
| Spain | 193 | 1,000,448 | 29 | 66,816 | 68 | 112,384 | 1,179,648 |
Table 1: Transfers related to the RIPE Registry by country
Although not part of the RIPE NCC service region, the United States features in this list because of inter-RIR transfers. In the last one and a half years, Softlayer Technologies, Inc. transferred 2.6 million IP addresses from ARIN to its RIPE NCC LIR account. These addresses will be used in the RIPE NCC service region, but as Softlayer is based in the US, the address blocks are listed under that country code in the delegated statistics files.
It is important to keep in mind that the table, by nature, includes some double counting. Address blocks which are exported from one country will be imported in another. Also, when more than two years have passed since the first transfer, blocks may be eligible for a second transfer. In total we count 125 blocks/375,040 IP addresses that have been re-transferred by the original recipient.
Looking at the evolution of Romanian transfers over time (Figure 4), we see how exports were booming between July 2014 and July 2015. Transfer rates came down significantly afterwards. Figure 4 also suggests imports started to pick up again in late 2016. However, the three largest acquired blocks, two /16s and one /17 (163,840 addresses), were in Romania only temporarily; they were later re-transferred to Saudi Arabia. As these were legacy blocks received via inter-RIR transfers from ARIN, the 24-month holding period for re-allocations required by the transfer policy did not apply.

Transfer Flows on the Country Level
Figure 5 shows the destination countries for all transfers originating in Romania - the undisputed leader when it comes to exports. We can see how six countries dominate these transfers. Together, Saudi Arabia, Iran, Romania, United Arabs Emirates, Portugal and Moldova account for 77% of the 7.1 million IP addresses transferred by Romanian LIRs.

Figure 5: Countries receiving transfers from LIRs in Romania. Numbers represent total amount of addresses transferred.
Table 2 lists the top 15 flows between countries. Next to Romania, only Germany appears with a significant amount of exports; 677,888 IP addresses having been transferred to Iran. For the other countries in the table, domestic transfers, where IP addresses stay within the country of origin, are the most dominant. Both Russia and the United Kingdom record over 2.5 million IPv4 addresses transferred internally. The United States also falls into this group. However, as discussed above, the situation here is a bit more complex. Although inter-RIR transfers may have left the IP addresses in the hands of organisations based in the US, they are expected to be used (all or in part) in the RIPE NCC service region.
| From | To | IPv4 addresses transferred |
|---|---|---|
| Russian Federation | Russian Federation | 3,220,224 |
| United States | United States | 2,621,952 |
| United Kingdom | United Kingdom | 2,601,728 |
| Romania | Saudi Arabia | 2,345,984 |
| Germany | Germany | 1,611,008 |
| Iran | Iran | 1,451,520 |
| Romania | Iran | 1,193,472 |
| Romania | Romania | 1,080,576 |
| Ukraine | Ukraine | 853,760 |
| Turkey | Turkey | 695,552 |
| Germany | Iran | 677,888 |
| Netherlands | Netherlands | 643,072 |
| Bulgaria | Bulgaria | 615,424 |
| Romania | United Arab Emirates | 524,288 |
| Italy | Italy | 437,760 |
Table 2: Top 15 transfer flows on the country level
Figure 6 shows the evolution of transfers in Russia and the United Kingdom over time. As in the region as a whole, relatively small transfers are the most common. However, the infrequent large transfers do contribute significantly to the total space transferred within the countries. The three largest transfers in the UK, conducted in August 2014, November 2014 and October 2016 respectively, account for 70% of all IPv4 movement within the country.

FIgure 6: Transfers in, from and to the Russian Federation and the United Kingdom
Conclusion
Within the RIPE NCC service region, modestly sized transfers continue to happen at a more or less steady rate; on average about 17,000 IP addresses have been transferred each day in the past three months, a bit less than a /15 per week. Occasional large transfers do increase the average, but one should take a careful look at originating and receiving organisations to properly interpret these in the context of a transfer market. When organisations are affiliated or engaged in another transaction (e.g. one acquiring part or all of the other's business) the transfers are more administrative in nature, and less likely to reflect supply and demand in a pure IPv4 address market.
On the country level, the largest flows see the IP addresses stay in the country they originate from, i.e. they are transferred to an organisation based in the same country as the originator. 54% of all transferred IPs within the RIPE NCC service region fall in this category. In terms of exports Romania leads by a far margin, while Saudi Arabia and Iran account for most imports.
Inter-RIR transfers happen less frequently. The large majority, especially when considering transfer sizes, see IPv4 addresses coming from ARIN to the RIPE NCC. A single transfer of 2,097,152 addresses (the equivalent of a /11) in December 2015 still dominates these statistics, and accounts for 47% of all IPv4 space coming to the RIPE NCC from ARIN.
Comments 2
The comments section is closed for articles published more than a year ago. If you'd like to inform us of any issues, please contact us.
Nick Hilliard •
it would be interesting to see number of transfers / number of addresses transferred per head of population.
Christian Teuschel •
Hi Nick, We intend to provide a feature like that in the country-based reports as mentioned in the RIPE NCC's activity report for 2017, https://www.ripe.net/publications/docs/ripe-671. Best regards, Christian (RIPE NCC)