This post describes a technique to detect bursty TCP disconnections, and how it can be used on RIPE Atlas data to better detect outages in the Internet.
As much as we dislike it, large scale Internet outages do happen, sometimes as a result of technical problems or sometimes even politically motivated. We'd like to be notified when these outages occur, ideally in real-time, as they can explain connectivity issues or other Internet phenomena (for instance events seen at a NOC). They can also potentially be seen as metrics for the health of the Internet.
As RIPE Atlas is now widely deployed, it has become an interesting platform to use for large-scale Internet outage detection. We have published a number of RIPE Labs articles on this already, and during two RIPE NCC hackathons, the "winning" projects (named "Disco" and "Halo") used RIPE Atlas for outage detection. However, there is only so much you can do at a two-day hackathon. So we decided to investigate this further in a longer-term research project, to see if we could use RIPE Atlas, specifically the connections from the probes to the RIPE Atlas infrastructure, to detect Internet outages in near-real-time.
The result is an outage detection system (we also call "Disco") that can detect outages in near-real time with high accuracy. Because of its nature, Disco is able to detect disconnections that occur even behind NATs.
Design
Disco is designed to detect synchronous disconnections of long-running TCP sessions. A single disconnection can be due to very local issues and not necessarily a network outage. Therefore, we detect bursts of disconnections, as they are a strong indicator of a more serious outage. This methodology can be applied to any environment that keeps TCP sessions alive, such as a large-scale video streaming platform. RIPE Atlas probes are distributed worldwide and they maintain an SSH keep-alive session with a controlling infrastructure. Connects/disconnects to these "controllers" are logged and are available as a live stream (measurement ID 7000). This is the sole input to our outage detection.
First, we split the disconnections into multiple streams:
- AS (all probes hosted in the same AS),
- Country (all probes in the same country) and
- Geo-proximate 50km radius (all probes that suffered a disconnect and are within a 50km radius of each other).
Splitting the disconnections into these streams allows Disco to eliminate noise from random disconnections and to look at the aggregations of probes that share some common characteristics: either topological or geographical.

Figure 1: Burst levels for Kenyan probes during June 2016 outage. Same day RIPE controllers were rebooted
As a next step we applied burst detection: counting the number of disconnections per time unit conceals information about the arrival rate of events. For example, if we use a one-minute time bin to count disconnect events, we will treat similarly three disconnects that occur within the same second and three disconnects that are uniformly spread out through the time bin. However, we want to put more emphasis on the three disconnects that happened at the same second, since synchronous disconnects are a stronger sign of outages. We used a modified version of Kleinberg's burst detection algorithm which models the rate of arrival of disconnections into a state model where a higher state (burst level) indicates probes losing connectivity synchronously. You can see more details in our paper Disco: Fast, Good and Cheap Outage Detection presented at the recent TMA conference. In Figure 1, we show an example of burst detection on the Kenyan sub-stream. On 7 June 2016 at 8:30 am UTC RIPE Atlas probes in Kenya lost connectivity due to power failure. Later, on the same day, RIPE Atlas controllers were rebooted and the probes lost connectivity again. However, the controller reboot disconnections were not synchronous enough and therefore achieved a lower burst level than the power outage emphasising the more "interesting" outage of the two.
Detected outages
We analysed disconnection logs from 2011 to 2016 and detected more than 400 significant outages that lasted more than 30 minutes. There were a number of outages that were caused by maintenance issues and gained some press attention: The Time Warner Cable outage on 27 August 2014, the AMS-IX outage on 13 May 2015, and the power failure in Kenya on 7 June 2016. We also detected recurring outages in Benin and Andorra which were not in the spotlight. Using other data sources, we confirmed that 95% of events reported by Disco are indeed network outages.

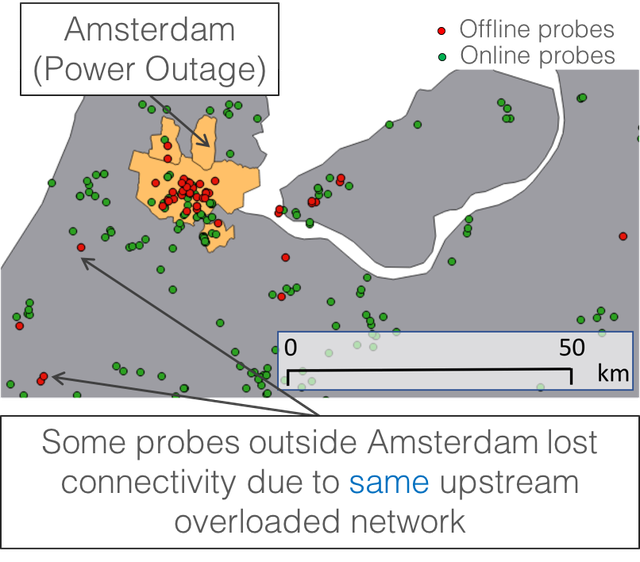
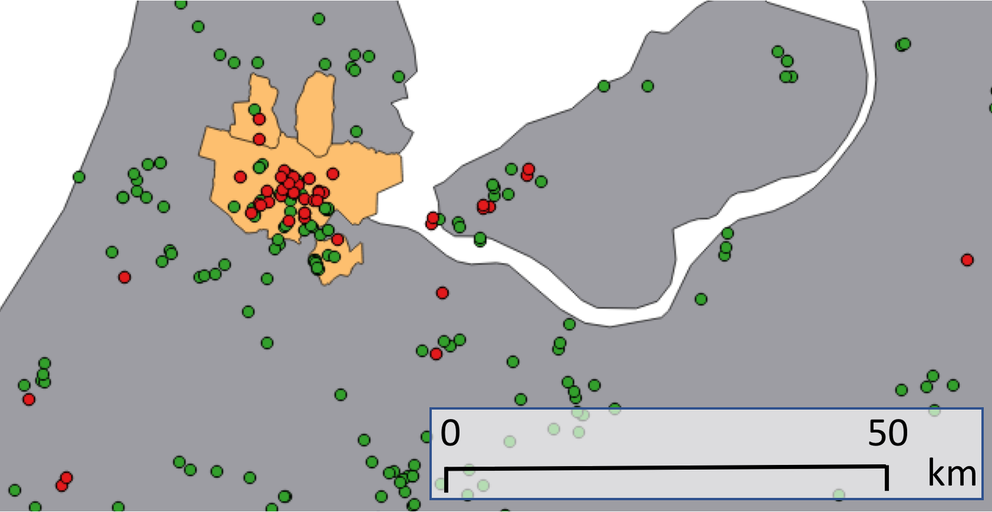
Figure 2: Amsterdam power outage on 17 January 2017
In Figure 2, we show a recent power outage in Amsterdam that was detected by our geo-stream on 17 January 2017. A large proportion of RIPE Atlas probes is concentrated within the boundaries of the city affected by the power outage. Interestingly, 19 of the probes in that disconnect burst are outside of the city boundaries. All these probes are hosted in a single network. Traceroute data and contact with the network operators revealed that, while these probes stayed physically powered, their Internet connectivity was disrupted between two network elements in the Amsterdam area, coinciding with the Amsterdam power outage. The operators of the affected network speculated that either a network element that terminates user sessions was overloaded by having to disconnect users in the power outage affected area, or the network between these two network elements, which is opaque to the network operator, in this case, was disrupted. The fact that Disco’s geo-streams emphasised this shows that we capture real events and interesting side-effects of outages in confined geographic areas.
Impact on traceroutes, where do they fail?
RIPE Atlas probes continuously run traceroutes (to DNS root servers and RIPE Atlas anchors) even when the connection is lost. These traceroutes are buffered at the probe and sent back to the controllers when the connection is re-established. We analysed these buffered traceroutes during the time detected as an outage.
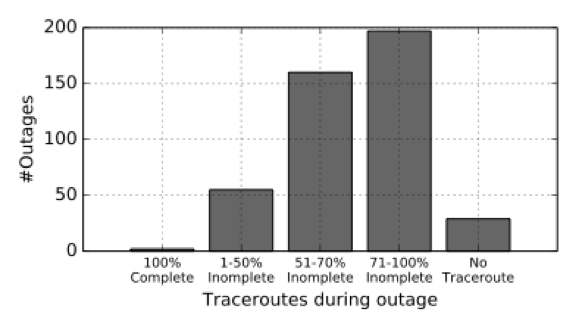
We find that in most cases, as expected, traceroutes do not reach intended destinations. Percentages of incomplete traceroutes are shown in Figure 3. In some cases, we see partial connectivity to DNS root servers. A complete lack of traceroutes from probes suffering an outage is a good indicator of a power outage, since the probes did not even buffer the traceroutes.

Figure 3: Percentage on incomplete traceroutes during detected outages.
Using the traceroutes from the previous day of an outage, we created a probabilistic model to learn about the most likely next hops of the traceroutes performed by the RIPE Atlas probes. Analysing hops where the traceroutes during an outage failed provides an indication of the location up to which the probe had connectivity. In our analysis, out of all the incomplete traceroutes, 73.5% failed outside the probe’s AS and 26.5% within the probe’s AS. We also observed that traceroutes from probes of a stream usually fail at the same IP address (predicted by the probabilistic model). In some cases, we also observed forwarding loops during outages. For example, during the Time Warner Cable outage in 2014, 73% of the traceroutes involved in the outage suffered a forwarding loop.
Conclusions
Disco is a fast, good, and cheap outage detection system that can monitor networks, even behind NATs. Out of the total IP address space we can monitor with RIPE Atlas, 25% was not previously monitored by ICMP probing techniques. Using the traceroutes from RIPE Atlas probes we can learn characteristics of the outage and get a better understanding of the outage location.
The burst detection algorithm developed for this research is available as a python module on github:
We are currently monitoring the RIPE Atlas disconnection stream and visualise the results at:
We also provide access to the data using a RESTful API there. We encourage readers to provide feedback on the API and help us improve our outage monitoring capabilities.


Comments 4
The comments section is closed for articles published more than a year ago. If you'd like to inform us of any issues, please contact us.
AlisonW •
I believe the caption for fig 2 should actually read "Figure 2: Amsterdam power outage on 17 January 2017", not 2014.
Mirjam Kühne •
Hi Alison, thanks for pointing this out. You are right. We corrected it in the article.
hayat bellafkih •
Very interested results, as a student, I am interested in the results, my question is about the data used for getting these results, are the buffered connections/disconnections available for public?
Anant Shah •
Hi Hayat, Yes the connect/disconnect logs are available via RIPE Atlas measurement 7000. You can also access our detection results using the API we built here: http://ihr.iijlab.net/ihr/api/doc/