Plug and Plot: Reusable Visualisations for AS-Hegemony Data
• 11 min read
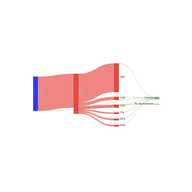
This article presents a set of open-source tools - “reusable visualisations” - that extend the AS hegemony visualisations provided by the Internet Health Report. Users can directly use the online tools or embed the IHR data on their own posts, webpages, or Observable HQ notebooks.
