
RIPE Atlas back-end applications run on more than 40 servers. Each day these machines can produce thousands of application logs of any kind of severity level. In order to be able to track down serious errors, warnings or even unusual behaviour, we decided some time ago to try Elasticsearch as a logging sink. In this article we will look at the design of such a system and describe how we can easily make sense from an ocean of logs.
When RIPE Atlas started back in 2010, it was using less than 10 back-end servers. At that time it was easy to connect to any of these servers and check out the logs to see if there was a problem on the application level. Nowadays RIPE Atlas has reached a total number of 40 production servers running different applications, and that number is still growing. With multiple releases per week - or even per day - we needed a system that could, among other features, show us the health of the whole system in real time.
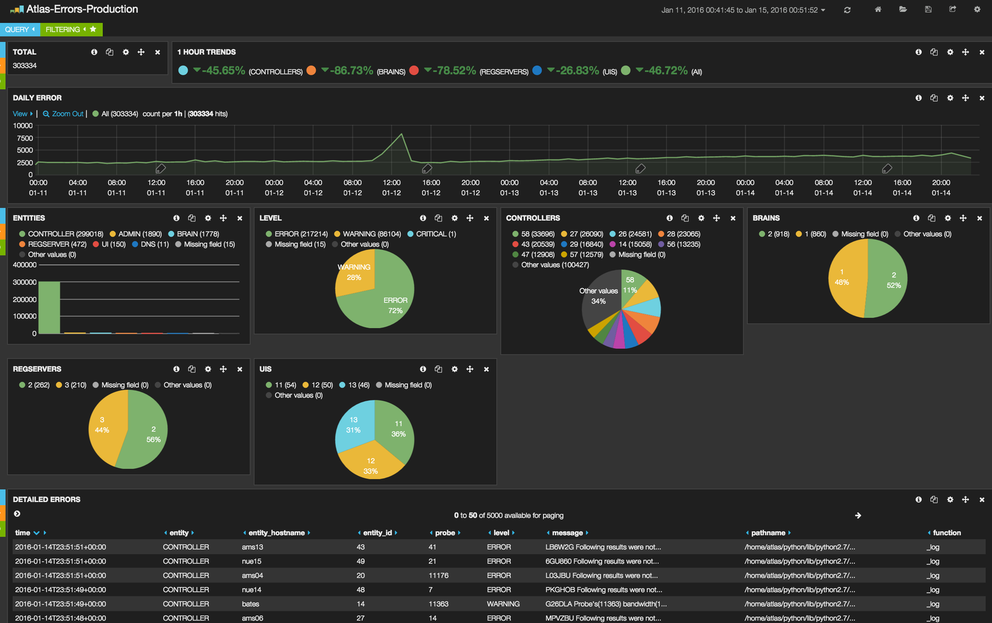
Most of our applications are built in such a way that as soon as we log something with a specific log severity level it is propagated to Elasticsearch using our existing messaging infrastructure. Using the Kibana dashboards like the one shown in Figure 1 we can see all gathered errors and filter them based on several parameters such as message, server, entity, etc. and discover potential problems.

Figure 1: Kibana's custom dashboard
Besides application logs, we also store metadata like the RIPE Atlas code release tags. We use Kibana chart markers to quickly see negative or positive impacts on the system after each release. In Figure 2 below you can see the impact of a release that was fixing a specific issue. After that release warning logs were decreased significantly.

Figure 2: Impact of a release that was fixing a specific issue
We also use Elasticsearch and Kibana's powerful visualisation capabilities to gain insight into new system behaviours or to find out how users are using our system. Using the existing logging pipeline we could stream specific events upon occurrence from our applications, which will end up on Elasticsearch in near real-time. The system currently adds a delay of ca. 15 seconds as we find this to be a good compromise between cluster load and operational awareness. Afterwards, using the Kibana dashboard, we can aggregate and analyse the events and find out system behaviours that would otherwise require a lot of work, or would be entirely impossible, to find.

Figure 3: Aggregating and analysing events with the Kibana dashboard
In RIPE Atlas we serve millions of HTTP requests per day. One more use of Elasticsearch and Kibana is to visualise our web server access logs and have a close to real-time overview of what is going on with our web interfaces. The log post-processing phase splits raw log messages into structured events which include fields with valuable information like HTTP response codes, times, sizes etc. Later on, these logs can be queried for ad-hoc analysis that complement the overview of the system that the dashboards offer. By combining these two use cases it's easier and faster for us to spot possible user errors. Figure 4 shows an example of a script that was producing a lot of traffic on our system. Using one of our Kibana dashboards, it became evident that the system was under a heavy load due to some sort of misconfiguration or abuse, which we managed to isolate and eventually identify the user behind it. This kind of visibility allowed us to contact the user and amend the script to prevent it from hammering our public APIs.

Figure 4: Identifying a script that created a lot of traffic
Conclusion
The Elasticsearch and Kibana tools helped us to maintain and analyse the wealth of log information produced by the RIPE Atlas infrastructure. The pilot experience proved the logging pipeline yields many benefits in our operations by increasing our visibility and awareness. As a result, we have begun work to improve the current setup and migrate our current configuration to the new release series of Elasticsearch and Kibana which, out of the box, simplify our setup and also offer many benefits for the logging sink use case (more performance for data aggregations, more stable cluster, more intuitive UI).
If you are using Elasticsearch, Kibana or similar tools we would love to hear from you about your experiences and also exchange some tips and tricks. Please leave a comment below.
Comments 0
The comments section is closed for articles published more than a year ago. If you'd like to inform us of any issues, please contact us.