
Pings provide a simple measure of how long it takes to get there and back across the Internet. What's not so simple is working out how long the trip there took versus the trip back. In this guest post, Ben Cox introduces a method for splitting the ping.
Ping is one of the fundamental pillars of networking. It’s simple, universally supported, and is normally one of the few things that is shipped with all network stacks. It gives us the ability to confirm that a host is reachable at all, and also a rough estimate on how much latency there is between the system running the utility and the target:
$ ping 8.8.8.8
PING 8.8.8.8 (8.8.8.8) 56(84) bytes of data.
64 bytes from 8.8.8.8: icmp_seq=1 ttl=120 time=3.29 ms
64 bytes from 8.8.8.8: icmp_seq=2 ttl=120 time=2.78 ms
64 bytes from 8.8.8.8: icmp_seq=3 ttl=120 time=3.09 ms
64 bytes from 8.8.8.8: icmp_seq=4 ttl=120 time=3.11 ms
^C
--- 8.8.8.8 ping statistics ---
4 packets transmitted, 4 received, 0% packet loss, time 3003ms
rtt min/avg/max/mdev = 2.789/3.073/3.298/0.186 ms
$
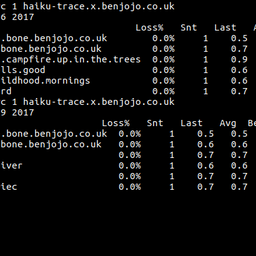
Monitoring pings over time is handy too, to spot positive or negative changes in network quality:

The basic mode of operation of a ping is this - an ICMP Type 8 is sent to the target and the host expects a ICMP Type 0 packet to come back. Latency is a measure of the time in between:

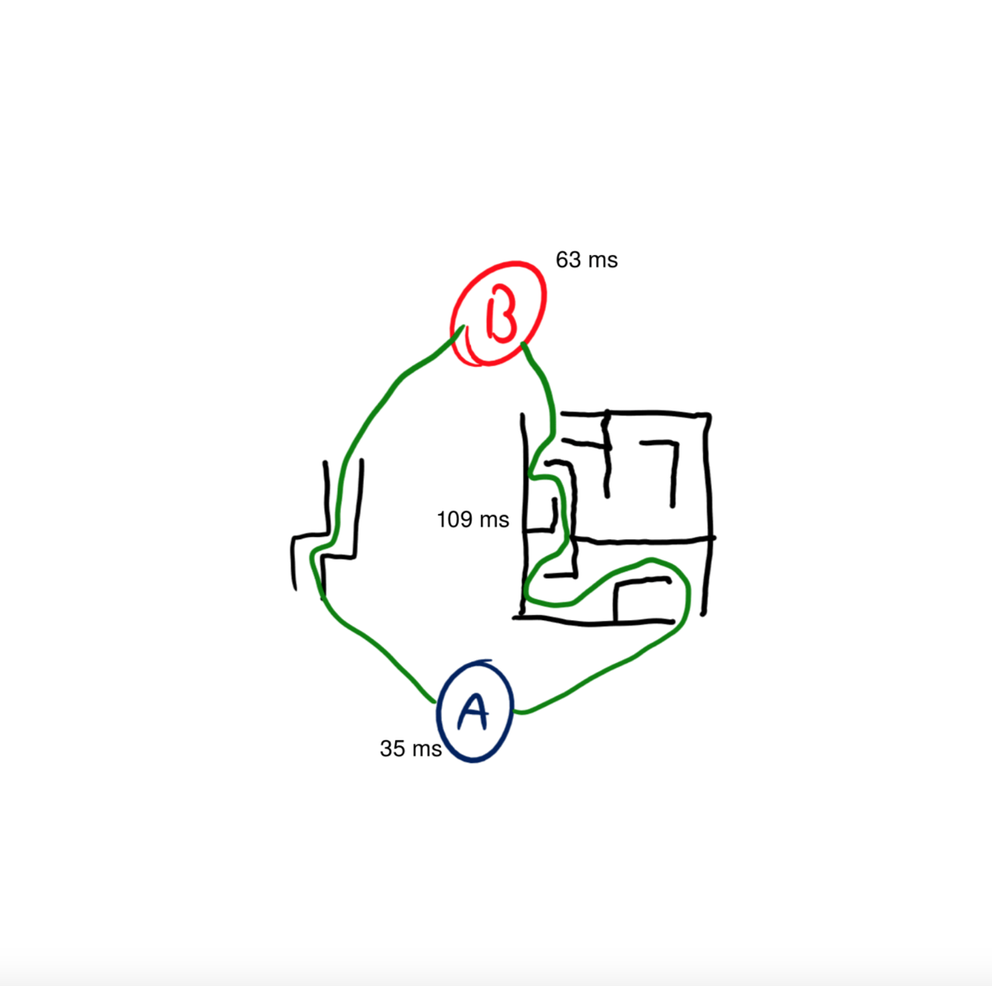
A common assumption on this latency number is that you can divide it in half to get the time it takes to send data in one direction (this assumption is sometimes used in “netcode”). While ideally that is true, the internet is full of asymmetric routing, meaning your ping’s path could look something like this:

In this example, it takes 63ms to send a packet, but only 35ms to get it back. To a normal ping, this would just show the latency as 109ms, but if we were to start making one-way latency assumptions based on that 109ms value we would have a decent amount of error (maybe up to 10ms) on how long communications would take to arrive.
The Question
So the question is: how do we “split” this ping into its transmit and receive time counterparts?
This whole idea came to me after watching a talk by apenwarr ((pdf)) about Google Fibre WiFi, and in there apenwarr mentions about a tool called isoping. Isoping is a program that does attempt to break up the difference between transmit latency and receive latency.
# ./isoping test.benjojo.co.uk
connecting to ::ffff:185.230.223.69...
                48.8 ms rx  (min=48.8)  loss: 0/2 tx  0/1 rx
time paradox: backsliding start by -396 usec
  48.8 ms tx    48.6 ms rx  (min=48.6)  loss: 0/3 tx  0/2 rx
  48.7 ms tx    49.0 ms rx  (min=48.6)  loss: 0/4 tx  0/3 rx
  48.6 ms tx    48.9 ms rx  (min=48.5)  loss: 0/5 tx  0/4 rx
  48.5 ms tx    49.0 ms rx  (min=48.5)  loss: 0/6 tx  0/5 rx
  48.5 ms tx    48.9 ms rx  (min=48.5)  loss: 0/7 tx  0/6 rx
^C

# ping test.benjojo.co.uk
PING test.benjojo.co.uk (185.230.223.69) 56(84) bytes of data.
64 bytes from 185.145.203.147: icmp_seq=1 ttl=54 time=96.6 ms
^C

# # 48 + 48 = 96
However, after more testing and talking to apenwarr, I discovered that it’s not capable of detecting long standing asymmetry.
It computes those based on the minimum observed RTT rather than the actual RTT. The minimum RTT is the floor on the precision available. But for detecting why a wifi link occasionally jumps to 500ms, or why your latency spikes when you upload a file, it’s very powerful.
So alas, isoping is well suited for jitter (aka, the issue they were targeting with the Google Fiber WiFi boxes) or detecting directional packet loss. But not against our problem of detecting chronic network asymmetrical routing.
So, again, how do we split the ping?

As we already discussed, an A ICMP ping measures the time between sending and getting a reply. So with no extra meta data, it’s impossible to gleam any asymmetry in the timing between RX and TX.

However, if we were to encode timing information in the packet, like when we sent it and have the other side include when it received it. We can use that to “split” the time it takes for the packet to be sent to the host, and then subtract that time from the total time to get the receive time.
Usefully, ICMP already has this feature in the form of Timestamp Requests.

As you can see in the Wireshark dissection, there is the Originate timestamp for when the host sent the packet, and the receive and transmit timestamps (usually identical) for when the other side transmitted this. I was not aware of any program that could do the half-RTT latency calculation for ICMP Timestamps, so I quickly wrote one:
$ sudo ./icmp-timestap-pinger
TS reddit.com (151.101.65.140): Forward: -1ms Back: 3ms RTT(2ms)
TS klir.benjojo.co.uk (5.231.83.4): Forward: 7ms Back: 5ms RTT(12ms)
TS airmail.benjojo.co.uk (23.132.96.179): Forward: 66ms Back: 65ms RTT(131ms)
TS syd-au-ping.vultr.com (108.61.212.117): Forward: 147ms Back: 153ms RTT(300ms)
This presents a problem though, since there is no guarantee that the host you are sending ICMP Timestamp Requests to has an accurate clock, so the value might not be calibrated to the same precision as the machine you are sending from, or even at all. To solve this, we need something that's like this, but with its own time accuracy assurances.
One way to do this would be to assure that all monitored hosts have NTPd/Chrony installed. However, this raises another question - how do you ensure that your IP paths to those NTP servers are not also affected by the asymmetry that you are trying to measure. NTP and Chrony can’t on their own prevent being biased from latency asymmetry. Chrony does have an “Estimation of asymmetric jitter”, but this cannot detect chronic latency asymmetry.
Therefore, to try and reduce the jitter, the idea would be to pick the lowest latency NTP servers, the idea being that there would be less room for asymmetry to play a role in the time estimation.
What are the best NTP servers?
For this I decided to run tests on the popular, and widely available NTP servers:
- Cloudflare
- Apple
To benchmark, I set up a uBlox 6M’s Pulse Per Second (PPS) line to be used as a time benchmark, using Linux’s PPS facilities and a Raspberry Pi 4’s (that I got as a speakers gift!) GPIO to trigger the interrupts. We can assume the uBlox’s PPS is nearly perfect, as it’s fed by GNSS sources, meaning it is the most accurate we can easily obtain (uBlox claims that accuracy of the pulse lies somewhere around +/- 100ns).
This means we can log when a pulse happens, and compare it against how close it was to our NTP system time:
root@tempest:~# ppstest /dev/pps0
trying PPS source "/dev/pps0"
found PPS source "/dev/pps0"
ok, found 1 source(s), now start fetching data...
source 0 - assert 1604603306.999999790, sequence: 1403151
source 0 - assert 1604603307.999999554, sequence: 1403152
source 0 - assert 1604603309.000000373, sequence: 1403153
source 0 - assert 1604603310.000000803, sequence: 1403154
source 0 - assert 1604603310.999999807, sequence: 1403155
source 0 - assert 1604603311.999999830, sequence: 1403156
The further away the time stamps are from the exact second, the more inaccurate the NTP source is (likely due to asymmetry or other network factors).

From a VDSL line in the UK on the ISP IDNet , it appears that Cloudflare’s time service provides the lowest error from GNSS calibrated time. But there's another quirk to take into consideration - where Cloudflare uses anycast to route NTP traffic into their network, Apple uses DNS to direct systems to what they think is the nearest time cluster. The upside of this is that all Apple clusters are reachable independently (Singapore, São Paulo Brazil, Hong Kong, San Jose USA, Los Angeles USA, New York USA, Miami USA, Atlanta USA, Sydney Australia, Frankfurt Germany, London UK, Amsterdam Netherlands, Tokyo Japan, Stockholm Sweden, Seoul S.Korea, Taipei Taiwan)
Because of this we can ensure we stay “locked” to an NTP cluster, and so I decided to use this Apple as the gold standard even though it’s error is higher (in my single location test). Facebook and Google time clusters are incompatible with each other in the case of leap seconds due to different implementations of smearing.
Timetables
Now that we have a synced clock we can get down to finally “splitting the ping”!
First we basically just build a table on both sides, with an incrementing packet ID and a unix timestamp slot, this table holds the ping packets we receive.

Since we swap these tables, we now know the exact time the packet arrived at the other side. Since we have accurate time, we can use these times directly to figure out the directional latency of the packet. On top of that, we can also use it to see what packets didn’t make it due to packet loss. Since we can see what packets we sent, and didn’t get to the other side, we can see packet loss direction too.
Here are some examples I found in the field:

Here I found a “peak hours” latency/jitter episode on a UK residential connection, happening in the inbound direction of the connection. Likely caused by peak hours streaming, etc.
In addition, this (some kind of DSL based) line has quite a significant amount of latency asymmetry:
[xxx.xxx.xxx.xxx] RX: 15.076895ms TX: 5.450551ms [Loss RX: 0/32 | Loss TX 0/32]
Where sending packets to the Internet has a 10ms delay attached compared to receiving them, this is likely some form of DSL Interleaving.
In another experiment I setup sping between my flat and a VM in China, and you can see the infamous daily peaks of packet loss:
Interestingly, this showed that the loss is in the direction of the UK to China, with a small period of China to the UK.
Sping
Since this tool is genuinely useful for debugging network latency, and for validating the viability of using NTP for really precise time keeping, I’ve factored it into a generally usable program in the form of sping: https://github.com/benjojo/sping
Usage of sping: -clock-is-perfect Enable userspace calibration against Apple's GPS NTP servers (default true) -debug.showslots Show incoming packet latency slots -debug.showstats Show per ping info, and timestamps -listenAddr string Listening address (default "[::]:6924") -peers string List of IPs that are peers -pps.debug Enable debug output for PPS inputs -pps.path string what PPS device to use (default "/dev/pps0") -udp.pps int max inbound PPS that can be processed at once (default 100) -use.pps If to use a PPS device instead of system clock -web.listen-address string Address on which to expose metrics and web interface (default "[::]:9523") -web.telemetry-path string Path under which to expose metrics. (default "/metrics")
The program can either trust system time, or in environments where it is not possible to set the time (some containers, OpenVZ etc) it can run its own calibration against Apple’s NTP servers, I found those to be the most consistent globally.
Optionally, it can also use a Pulse Per Second device for greater accuracy.
sping uses UDP to exchange ping data between peers, and TCP for the handshake. The IANA port assigned for this is 6924.
________
Originally posted on Ben's blog March 2021.
Comments 4
The comments section is closed for articles published more than a year ago. If you'd like to inform us of any issues, please contact us.
Stéphane Bortzmeyer •
The README of sping has no usage instructions https://github.com/benjojo/sping/issues/4 https://github.com/benjojo/sping/issues/5 so, since it is not obvious, here is a summary: 0) Check that you have a clean path between the two machines (UDP port 6924 must pass) 1) On the responder (server / slave / pick the name you want), run sping without arguments 2) On the initiator (client / master / pick the name you want), run sping with -peers (I tried with IP addresses, may be it also works with names), for instance './sping -peers 192.0.2.11'. The result are displayed in the Web interface (by default, 'http://[::]:9523/metrics') under 'splitping_latency'. If you prefer see them in the console, add -debug.showstats to sping.
Andrzej Duda •
Nice work. We did a similar analysis but with the goal of improving NTP accuracy - "Calibrating NTP", ISPCS 2019: 1-6: https://hal.archives-ouvertes.fr/LIG/hal-02305093v1
Michael Booth •
Very nice write up, I like the detail of two way trip time. I'd also recommend looking in to ITU Y.1564, this works end to end at the application layer which may be more accurate. An ICMP ping may be processed by the processor on each layer three node (adding increased latency to what would be seen by other protocols such as http).
Stéphane Bortzmeyer •
« An ICMP ping may be processed by the processor on each layer three node (adding increased latency » Hmmm, certainly not. If you *direct* an ICMP echo request to a router, yes, the processing by the target (the router) will typically be slow, but, if you direct it to a remote machine, for all the routers on the path, it will just be an ordinary packet, forwarded like any other.