
In response to numerous requests made by our members and the wider community for more country-specific statistics, we developed additional functionality in RIPEstat that shows various datasets by country. A new widget called Country Routing Statistics is now available, along with the ability to compare the situation in different countries side by side.
Country Routing Statistics
This new Country Routing Statistics widget shows the number of IP prefixes (IPv4 and IPv6) and Autonomous System Numbers (ASNs) in a country over time, as seen in the Routing Information Service (RIS). The x-axis shows the timeline and the y-axis shows the number of prefixes and ASNs. You can enter either a county name or ISO country code.
In Figure 1 below, you can see an example of the situation in the Netherlands from 2004 until the present day, including:
- The number of ASNs (brown line)
- The number of IPv4 prefixes (blue line)
- The nuber of IPv6 prefixes (green line)

In this image you can see that the number of IPv4 prefixes visible in the routing table has been growing steadily since 2004. The number of IPv6 prefixes has recently increased and has now reached around 400.The number of ASNs has increased more slowly over time.
When you move your mouse over the graph, you can see the exact number at that time of date (see Figure 2).

You can also use your mouse to zoom into the graph and highlight one particular range of time. To zoom in, you can drag a rectangle inside the graph over the time period you're interested in, or in the overview time bar under the graph. The two buttons, "zoom out" and "reset zoom", at the top right of the graph allow you to zoom out by the steps as you zoomed in or entirely. Note that the granularity of the data changes according to the some level (from 1 week to 5 minutes).
If you are interested only in certain datasets, you can switch off the others. For instance, if you only want to see the IPv6 and ASN graphs, you can switch off the line showing the IPv4 prefixes by clicking on 'IPv4' in the legend (see Figure 3).

Country Comparisons
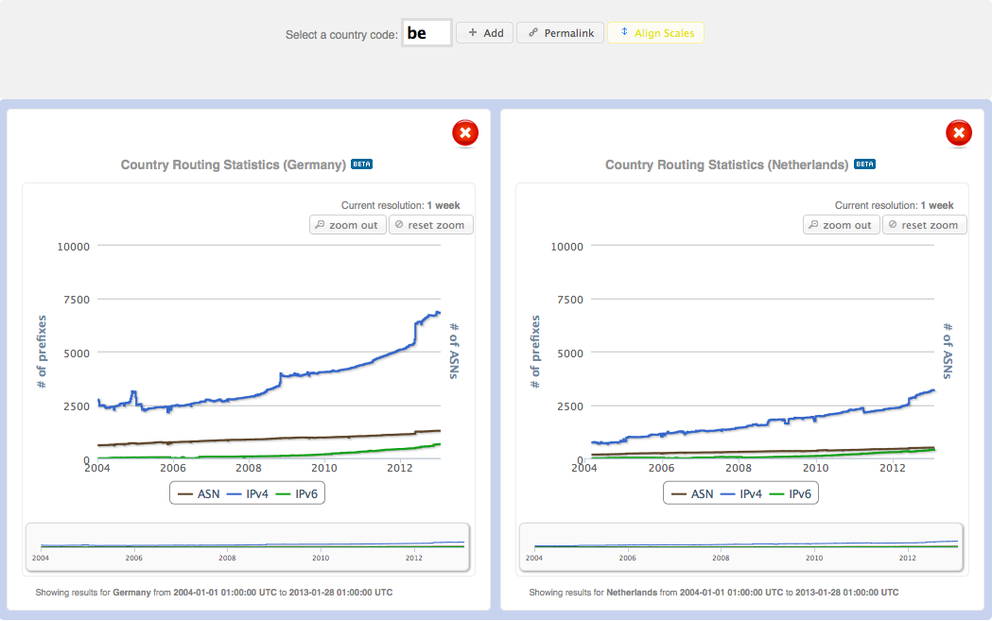
On the Country Comparison page you can compare up to four countries at the same time. In Figure 4 you can see an example showing the data for Belgium and the Netherlands next to each other. All other functionality desribed above also applied to this comparison page.

Permalink and aligning scale
Please note that you can create a permalink for the countries you selected. For that, you need to click on the little Permalink icon on top of the widget, and it will provide you with a permalink for that particular output (see Figure 5).

You can also toggle the scale of the graphs you want to compare by clicking on the 'Align Scales' icon.
Data and Methodology
The data displayed in the Country Routing Statistics widget is based on routing information collected by the RIPE NCC's Remote Routing Collectors (RRCs) distributed all over the world and presented in the Routing Information Service ( RIS ). Each of these collectors records BGP routing information and sends the information to our central infrastructure for aggregation and processing. For this particular widget, the data is based only on one collector: RRC00.
After obtaining the data it is mapped to countries using the statistics file , a public record of all resources allocated by each of the five Regional Internet Registries.
It's possible that a given country might show a large increase/decrease in the number of IPv4 or IPv6 prefixes at a certain point in time. In most of these cases this happens when ISP(s) in the country aggregated or de-aggregated their prefixes, resulting in fewer or more entries in RIS and a sudden change in the number of prefixes. Alternatively, prefixes may have been mapped to a different country name at different points in time as a result of changes in the RIR statistics files. And then, there are shutdowns of the Internet as we saw happening not just once in the past years.
You can find more information when clicking on the "info" button at the bottom right of the widget.
Feedback
We want to hear from you!
You can offer feedback on RIPEstat at any time through one of our dedicated channels:
- The comment box on the RIPEstat website allows you to post comments if you are a registered RIPE NCC member
- There is a feedback button available at the top right corner of every RIPEstat widget
- The Measurement Analysis and Tools (MAT) working group mailing list allows for more in-depth discussions
- Private feedback can be sent to stat [at] ripe [dot] net
- The #ripestat tag on Twitter is used by the RIPE NCC to discuss and announce the latest RIPEstat news and features

Comments 0
The comments section is closed for articles published more than a year ago. If you'd like to inform us of any issues, please contact us.