

Every so often I hear the claim that some service or other does not support IPv6 not because of some technical issue, or some cost or business issue, but simply because the service operator is of the view that IPv6 offers an inferior level service as compared to IPv4, and by offering the service over IPv6 they would be exposing their clients to an inferior level of performance of the service. But is this really the case? Is IPv6 an inferior cousin of IPv4 in terms of service performance?
Let’s try and answer that question by using measurement. In this article I’d like to report the results of a large scale measurement of IPv4 and IPv6 performance looking at the relativities of IPv6 and IPv4 performance.
What is “Performance”?
In networking the term “performance” can have many aspects. Often we might characterise a network’s performance by its carrying capacity, or by its end-to-end delay, or its level of delay variation or jitter. Each of these parameters could affect an application’s performance. A large scale data transfer is affected by carrying capacity and by end-to-end delay, while a raw encoding of a voice or video stream could be more sensitive to jitter than to the end-to-end delay.
But when we are looking at the relative performance of these two IP protocols then many of these performance concepts fall out of scope. If we have two sessions running between the same endpoints, using the same end-to-end transport protocol and using the same applications at each end, performing the same transaction at much the same time, and we vary only the IP protocol using by these two sessions, than much of what we observe as “performance” is constant across both transactions. If that’s the case, then what can vary when we vary the IP protocol?
There appear to be two aspects of performance that can vary between the two protocols that will have impact on the end result.
The first is the reliability of the protocol. Are all connection attempts successful? Do we observe a higher connection failure rate in one protocol or the other? Is there middleware deployed on the network path that is dropping IP packets based on the IP protocol?
The second is the round trip time. Even though the same two endpoints are involved, the network path used by one protocol may vary from that used by the other. In the routing world the routing protocol often operates on a per-protocol basis, and even peering and transit arrangements used between providers may differ by protocol. The result can be divergent paths across the network. There are also more subtle issues with packet handling within the router. Depending on the header options in the IP packet and depending on the type of router it can be that IP packets of one protocol are switched via some optimised pathway, while packets of the other protocol are switched via some slower path. The result can be a situation where packets of one protocol may require more time to traverse to a network than the other. The longer the transmission time between the two endpoints, the greater the impact on the performance of any network transactions.
This leads to the observation that for the purposes of comparing the performance of these two versions of IP, what we would like to look at is the relative levels of reliability of connection establishment and relative round trip times across a series of experiments where the other factors are held constant. Does changing just the IP protocol from IPv4 to IPv6 have any impact on the anticipated performance of the network transaction?
Measuring Performance
This measurement is based on data collected from end user measurements. The measurement technique uses an advertisement distribution network to load a measurement script on a user’s browser. The script fetches three invisible pixels, one using a URL that is only accessible using IPv4, the second with IPv6 and the third is accessible using either protocol. All of these pixels are loaded from the experiment’s servers, and a full packet log is recorded at each server. The actual measurements are performed at the server end, not by the user side endpoint.
Connection failure is challenging to measure from the server, as the task has some aspects of attempting to measure something that does not in fact exist. However we are using TCP in this measurement, and one aspect of connection failure is visible to the server. TCP uses a three-way handshake to start a session. Normally this looks like Figure 1. The server receives an opening TCP packet with the TCP SYN flag set. The servers will respond with a TCP packet with the SYN and ACK flags set, and the connection is complete when the server receives an ACK packet.
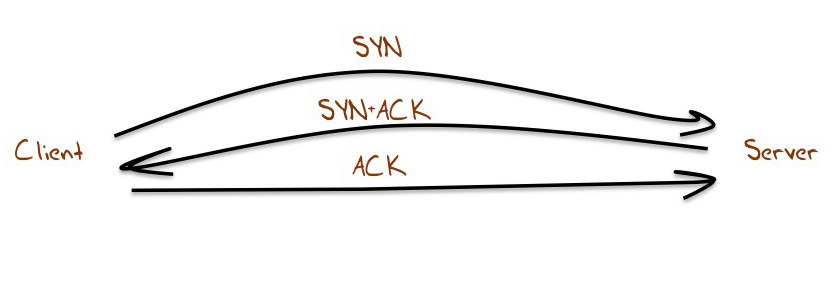
Figure 1 – TCP Handshake
One visible form of failure is a hung connection, where the server sees and responds to the opening SYN, but fails to receive the ACK to complete the connection. What we can measure for each protocol is the relative ratio of hung connections. What percentage of all connection attempts fail to complete, and is this number different when considering IPv4 and IPv6 connections? This is not a complete picture of connection failures, as we may even see the initial SYN of an attempted connection, but it is a useful comparative metric, in that it allows us to directly compare one aspect of connection robustness between IPv4 and IPv6.
The second measurable quantity is the end-to-end delay, measured as a round trip time. TCP provides a constant record of round trip time measurements by looking on the server at the time when data was sent and the time when that data was acknowledged. However this data can be noisy, with elements such as delayed ACKs in the TCP protocol, and client side issues, such as internal job scheduling both in the host operating system and with the browser itself, and similar server-side issues. One way to avoid much of this added noise component to the underlying signal of round trip delay is to look a the time taken to complete a TCP connection, from reception to the initial SYN to the ensuing ACK. This TCP connection operation is normally performed within the operating system as a kernel function and is less prone to imposed jitter from the external factors, so offers us one of the clearer ways to view the end-to-end round trip delay.
So let’s compare IPv4 and IPv6 using these metrics of connection failure and relative RTT.
Measurement Results
This experiment was initially performed in 2011 and performed a second time in 2015, giving us the means to see whether the situation has moved or not over the past 4 years.
Connection Robustness
Figure 2 shows the daily connection failure rate across 2011, comparing IPv4 and IPv6. It’s striking that IPv6 was so bad at establishing connections, with a consistent record of some 40% of all connection attempts failing to complete. By comparison, the IPv4 failure rate was some 0.4%
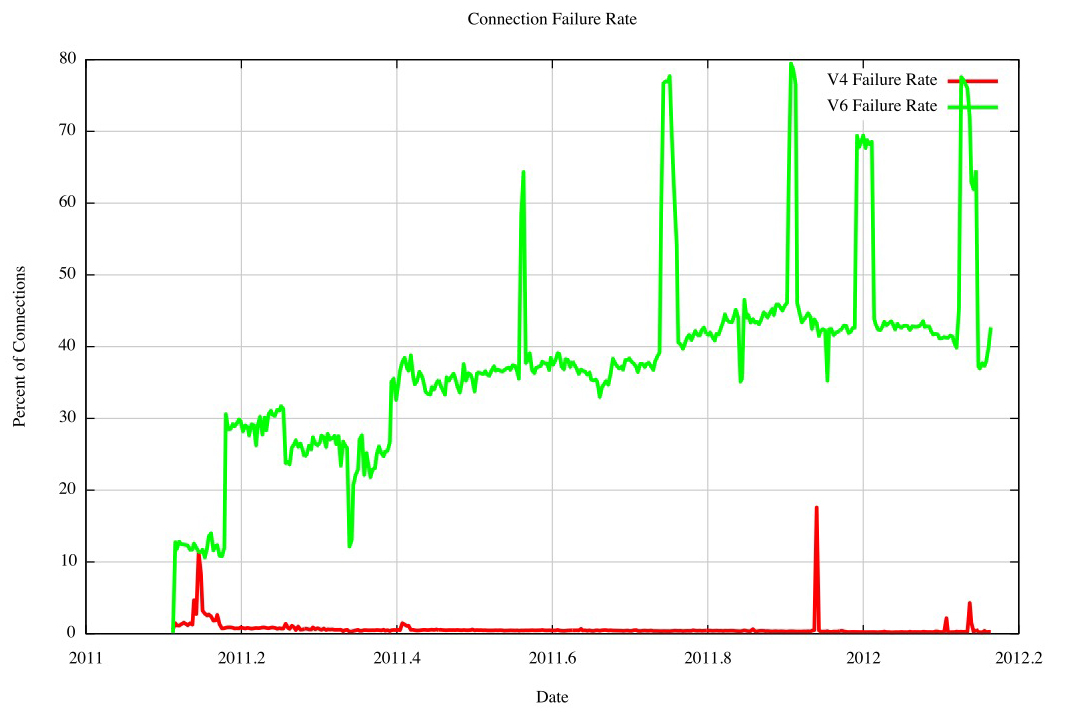
Figure 2 – Connection Failure Rates by Protocol – 2011
The IPv4 failure rate dropped across this period (Figure 3), and the isolated spikes appear to be some form of port 80 scan.
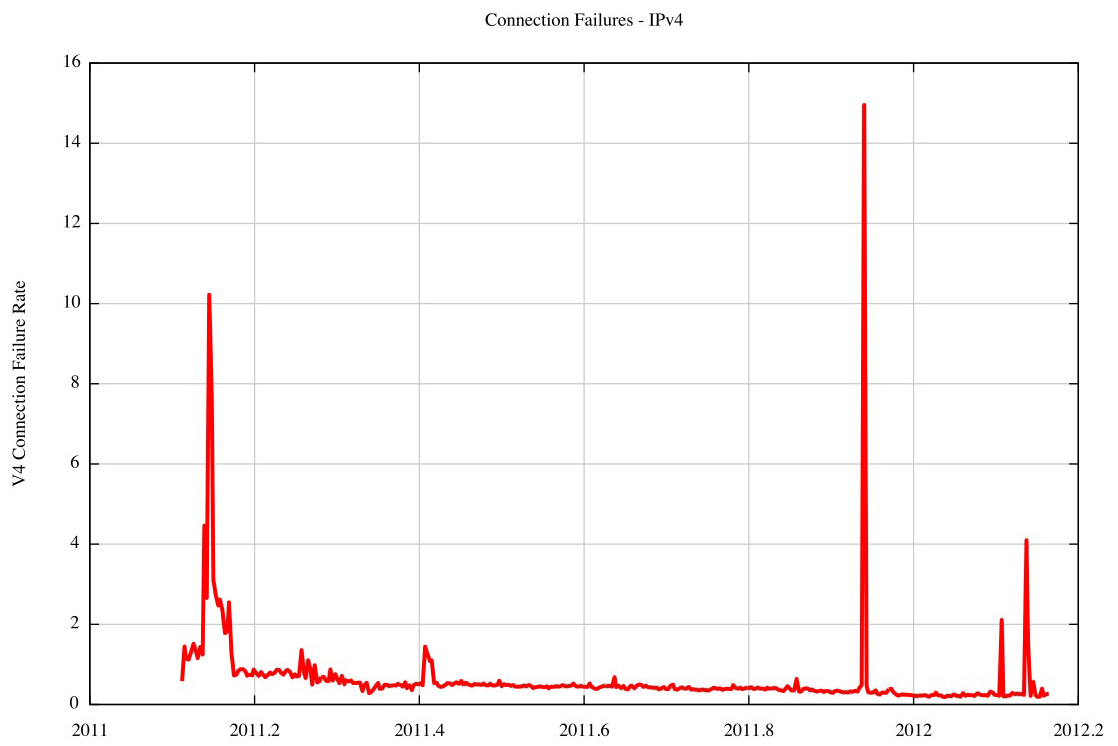
Figure 3 – IPv4 Connection Failure Rates – 2011
The IPv6 failure picture becomes clearer when the IPv6 address used to attempt the connection is sorted into a Teredo prefix (2001::/32), a 6to4 prefix 2002::/16 or all other unicast address prefixes. This breakdown of connection failure rates by address type is shown in Figure 4.
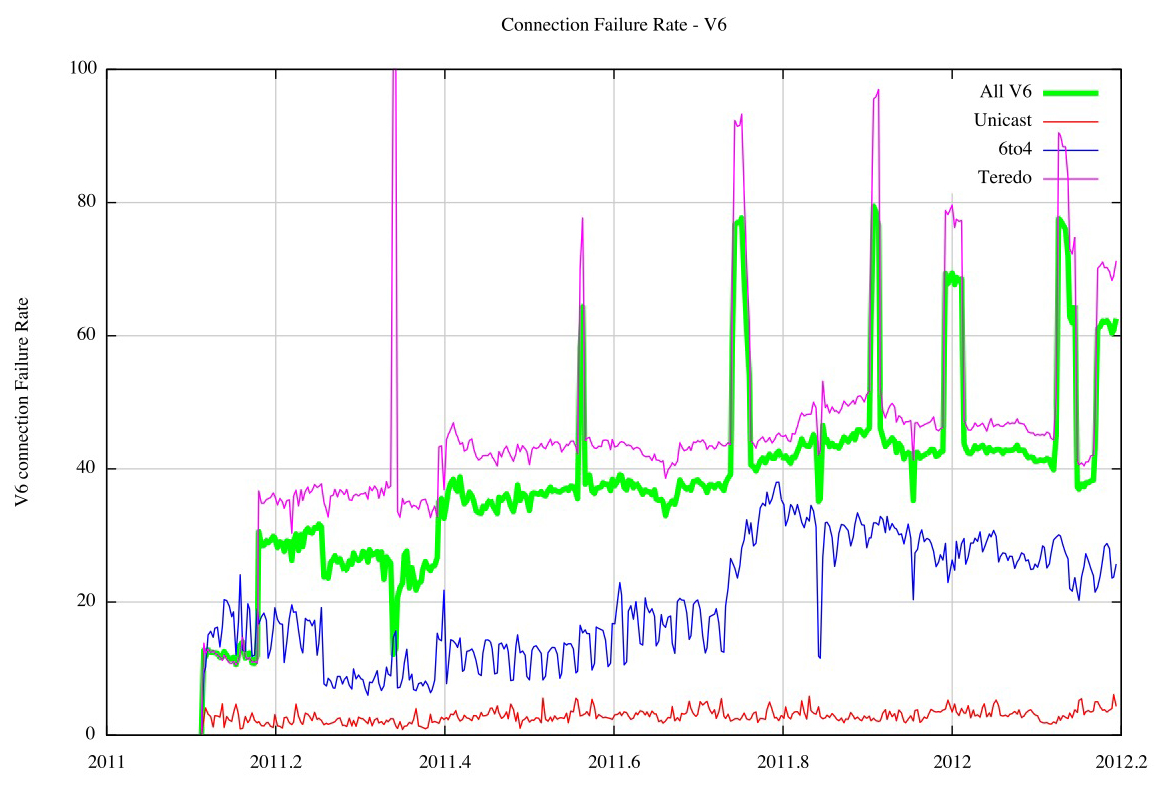
Figure 4 – IPv6 Connection Failure Rates – 2011
Teredo was highly unreliable at the time, showing a daily connection failure rate that was consistently greater than 40% of all Teredo connection attempts. Teredo’s relatively complex operation, and its objective to establish a usable NAT state, both count against it, and the resultant failure rate illustrates the proposition that Teredo was perhaps more of a liability than a positive contribution to IPv6. The 6to4 failure rate of between 20% to 30% by the end of 2011 was admittedly better than that of Teredo, but in absolute terms it is still unacceptable. Unicast IPv6 shows a “better” failure rate of some 5% of all connection attempts, but in absolute terms a 5% failure rate is still somewhat unacceptable, and certainly far worse than IPv4’s comparable failure rate of less than 0.5%.
Has this changed over the intervening 4 years?
The data analysis was repeated over 2015, looking again at connection failures. The comparable data on overall connection failures is shown in Figure 5.
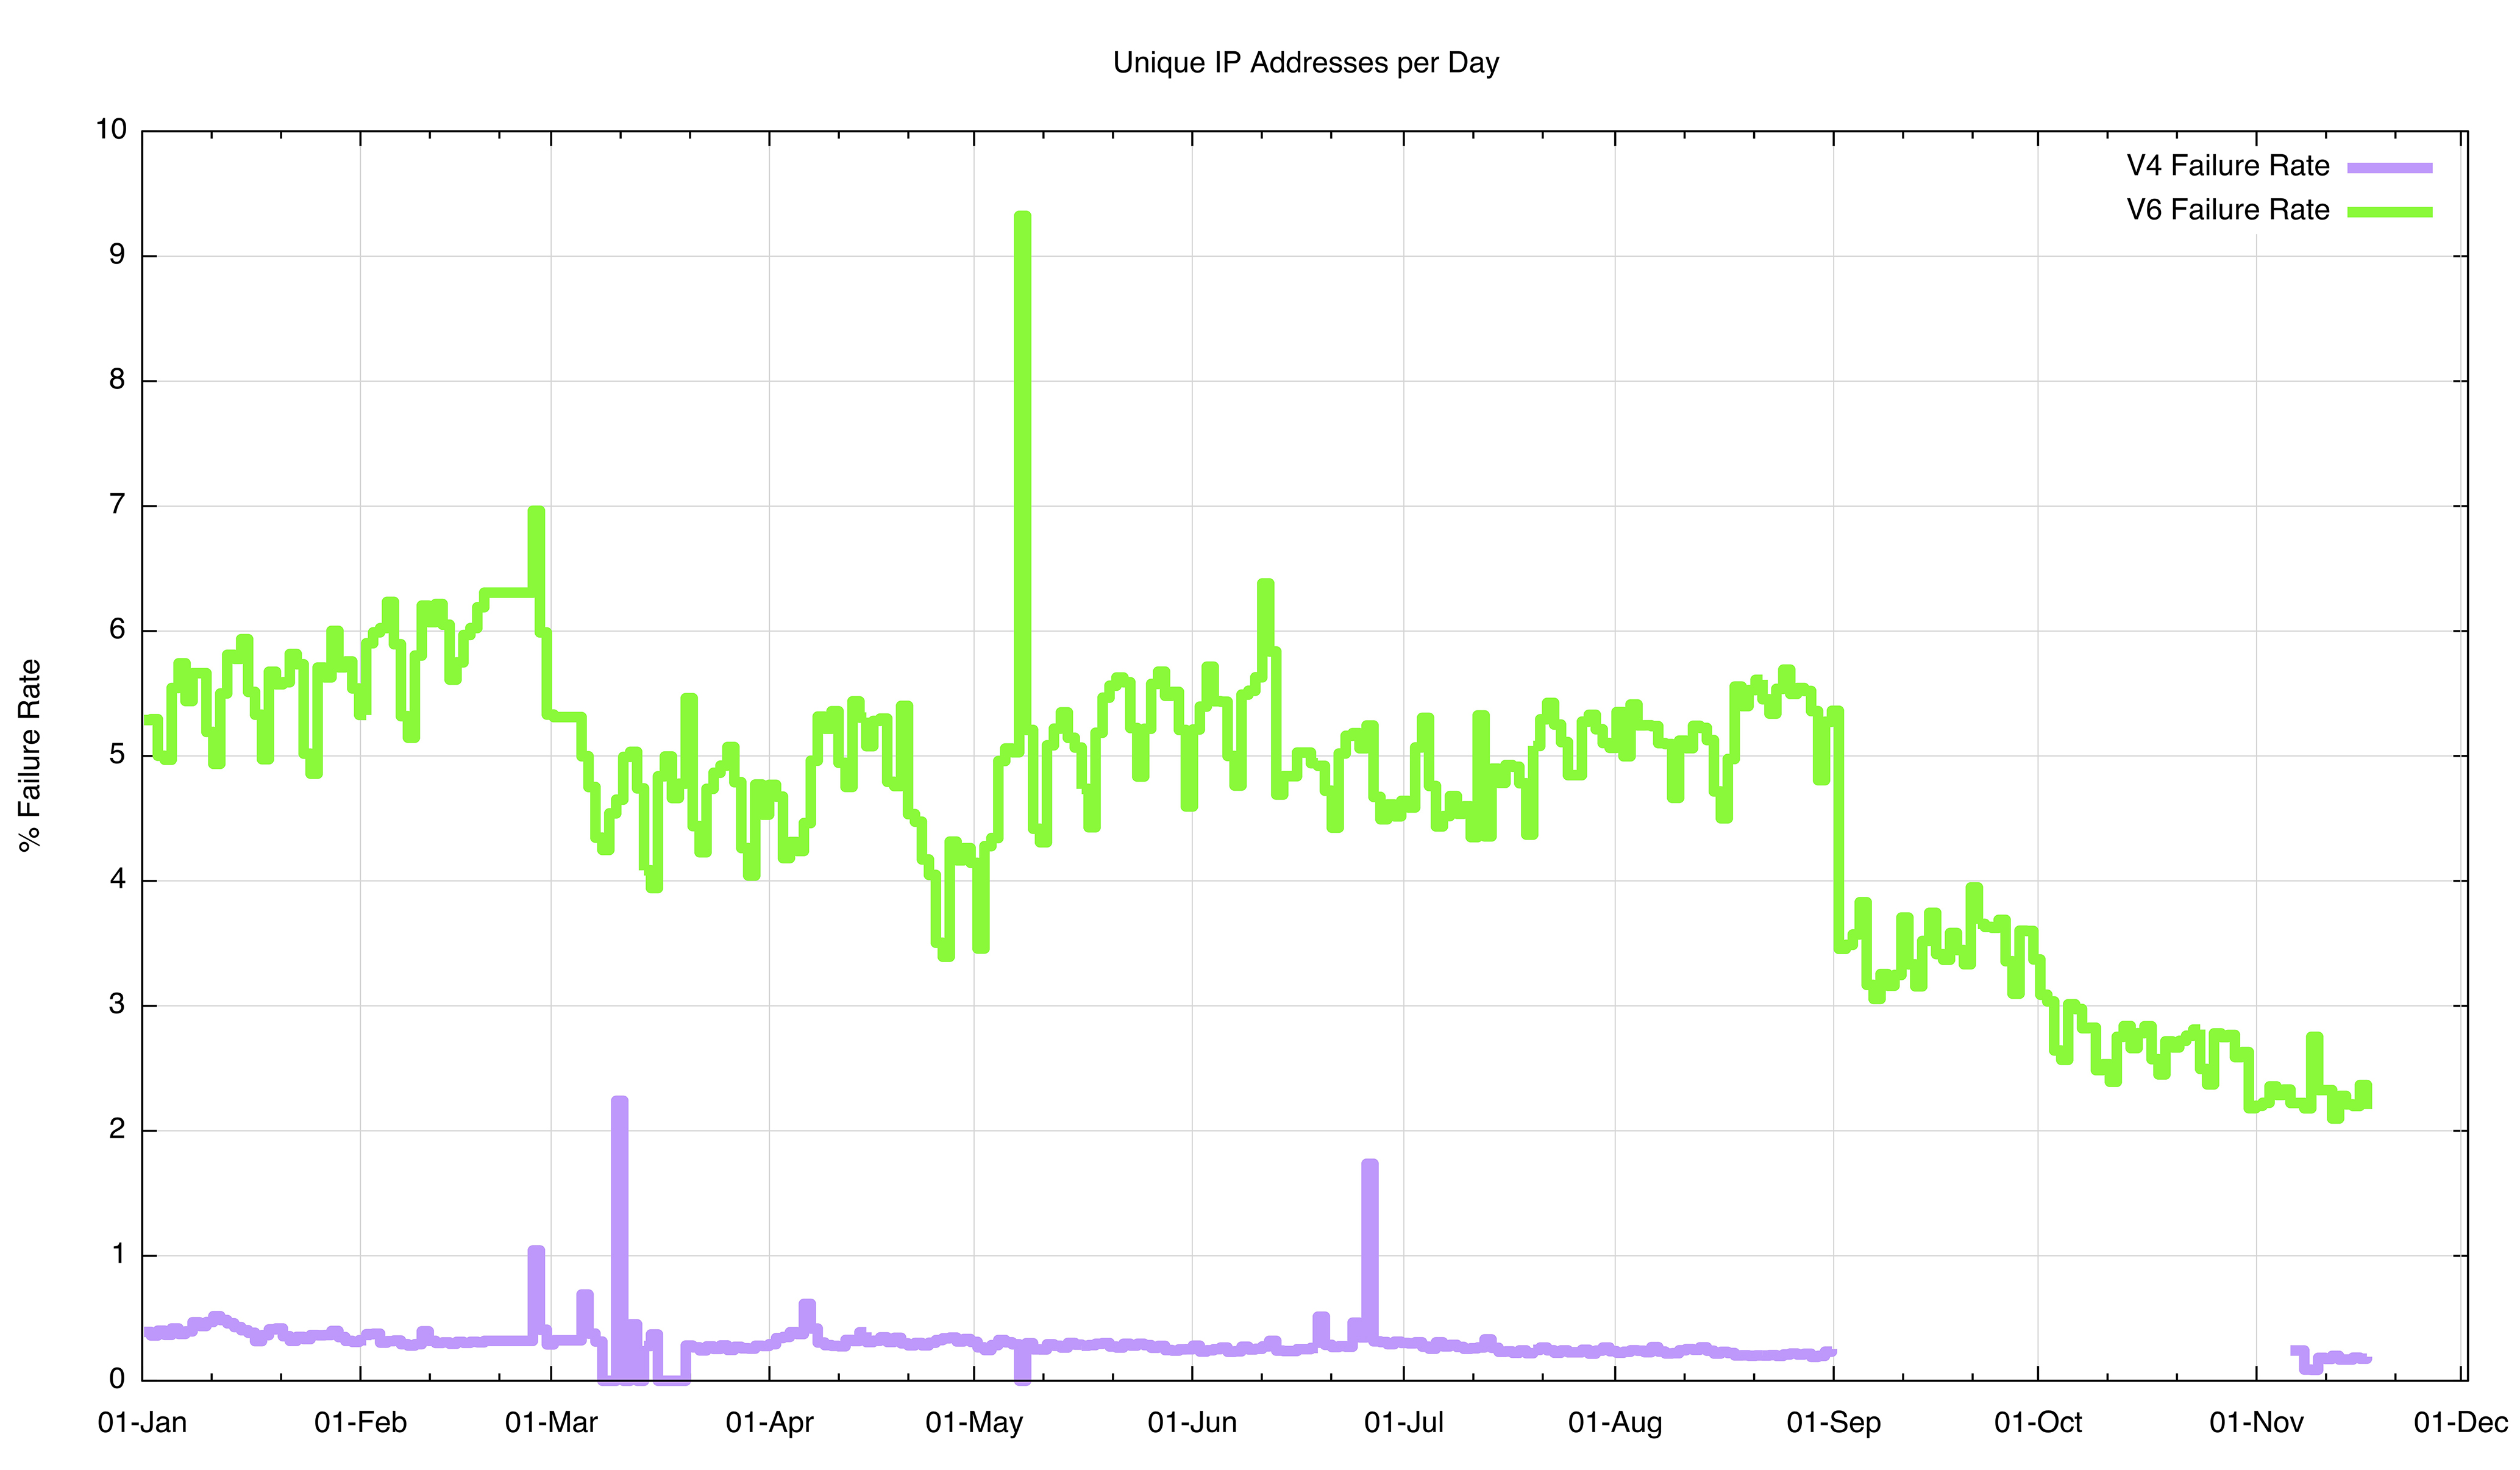
Figure 5 – Connection Failure Rates by protocol – 2015
The data for IPv4 is not complete for the entire period, and there is no packet capture data for IPv4 in the period September – October. There is also a visible discontinuity in the data for IPv6 on the 1st September. In the July and August period the measurement platform used a combination of advertisements scripted using Adobe’s Flash and HTML5. The advertisement platform ceased support for Flash as of 1 September and the change to an all-HTML5 profile changed some of the relativities of the IPv6 systems being used for measurement.
The IPv4 connection failure rate shows a steady decline over the year (Figure 6). The connection failure rate by mid November 2015 was 0.18%.
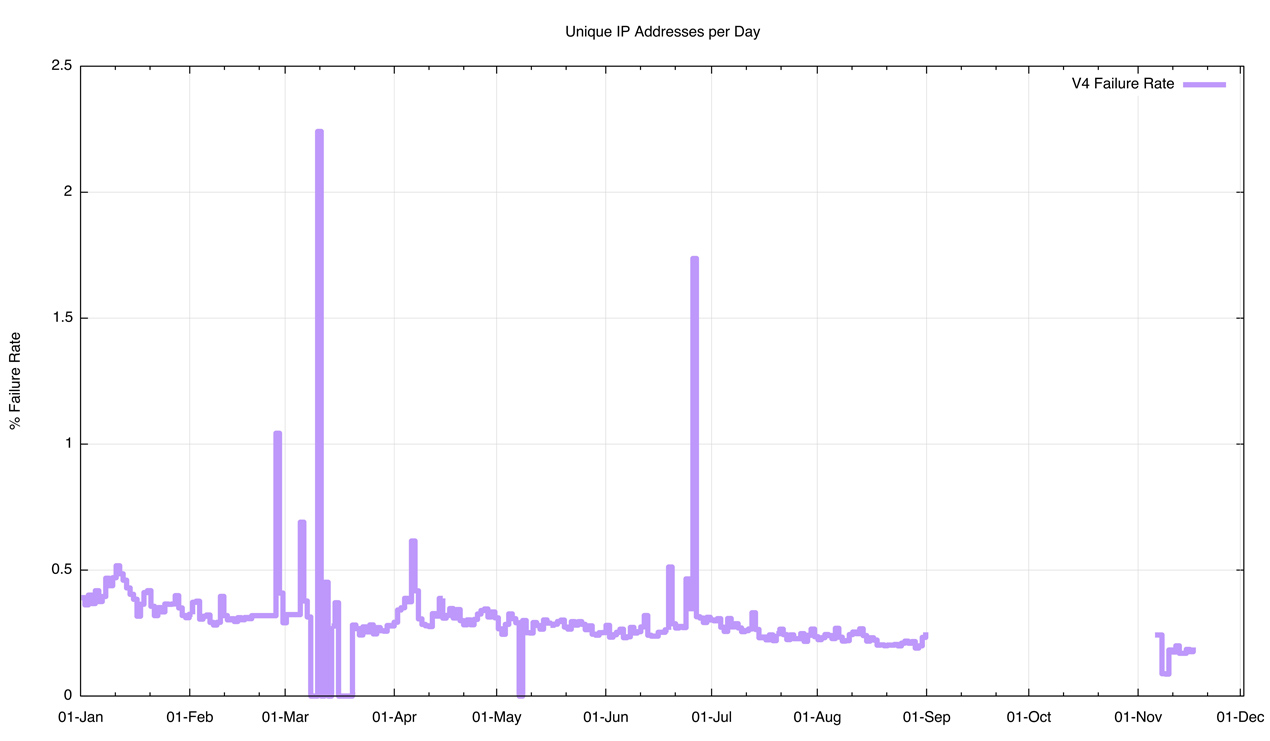
Figure 6 – IPv4 Connection Failure Rates by day – 2015
Four years ago the poor IPv6 connection performance was largely due to the prominence of the use of Teredo, which had an excessive connection failure rate, and was helped by the widespread use of 6to4 which was not all that better. In the intervening four years Teredo has all but disappeared, due largely to a combination of successive releases of Windows systems effectively deprecating Teredo and the withdrawing of the Microsoft-operated Teredo relay services. But while Teredo has affectively disappeared, 6to4 has not, and its poor ability to complete connections has not changed greatly either, and connection failure for 6to4 is still between 8% to 10% of all 6to4 connections.
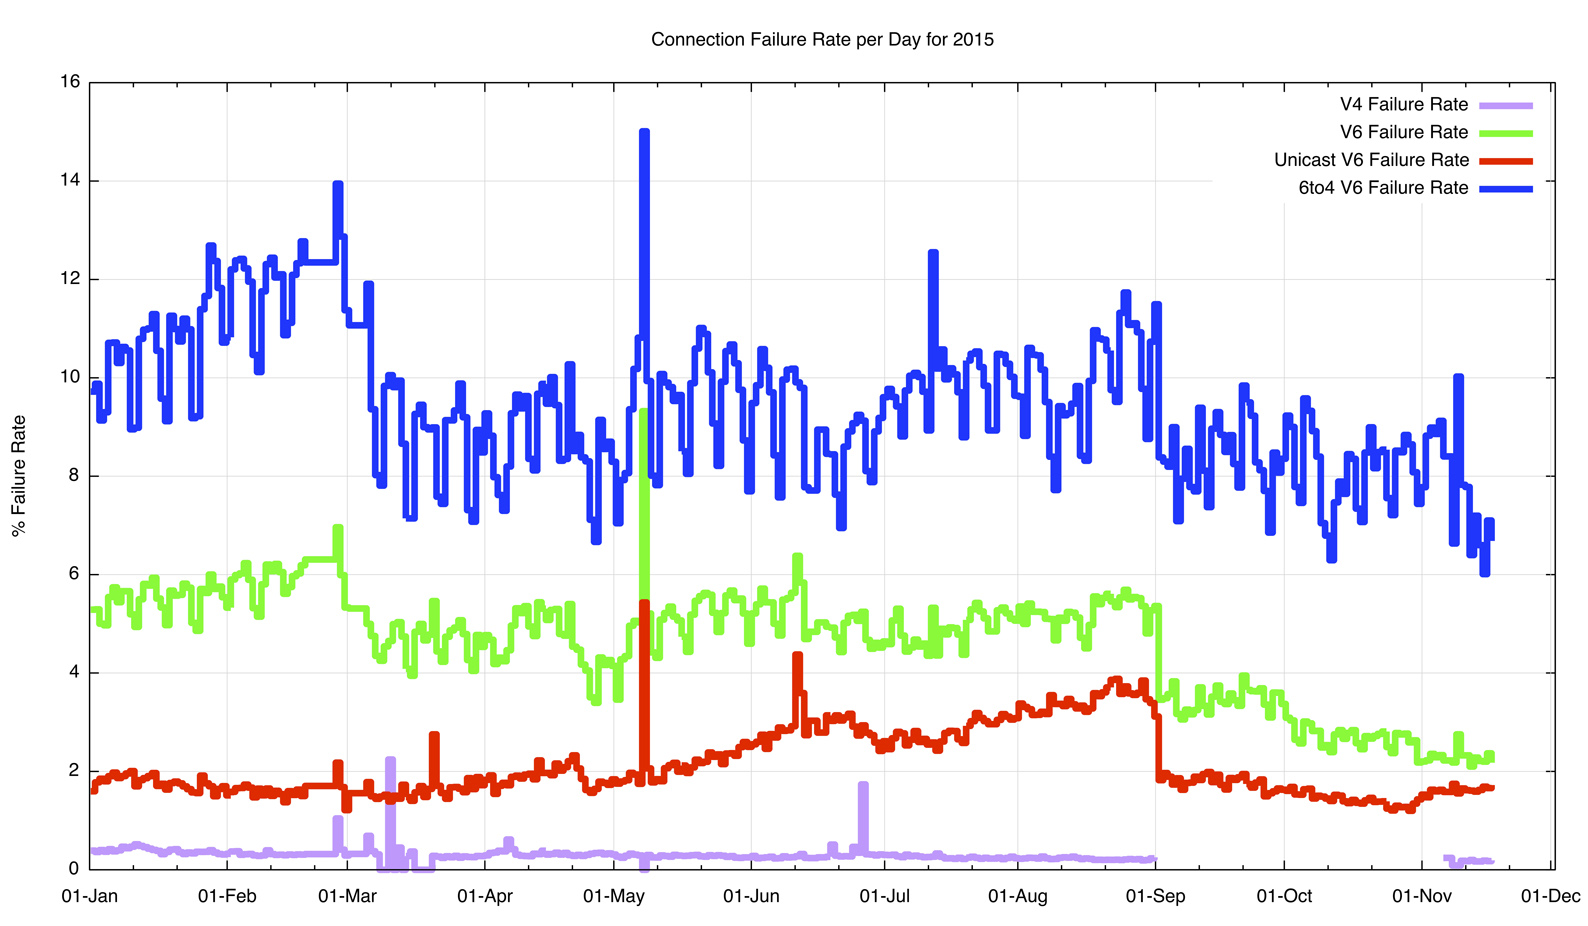
Figure 7 – Connection Failure Rates by Day – 2015
If we discount the 6to4 connection failures, then the resulting profile is an average connection failure rate of 1.8% of all IPv6 connections. This is far better than the 5% seen in 2011, but there is still room for improvement. The comparable number for IPv4 is at 0.2%, which should be where the IPv6 infrastructure should be heading.
There are perhaps two lessons to draw from these measurements. The first is that, in general, IP tunnels are not the best idea to have. Whether it’s IPv6 inside IPv4 as in 6to4, or even a more generic IP-in-IP as in LISP, IP tunnels increase the fragility of the resultant service environment. If you don’t need to tunnel, then its better to avoid it. The second lesson is that there is a large amount of largely forgotten unattended devices out there on the network that are causing issues. It appears that most of what we are seeing in unicast IPv6 failures is network equipment that is not working in sync with its end client base. It is likely in many of the failure cases that endpoints assume that they have IPv6 connectivity and emit an IPv6 packet, but a filter in the network is configured to block all incoming IPv6 packets.
Relative Round Trip Time
The second aspect of relative protocol performance examined here is that of relative network path delay. What we do here is to look at those endpoints that are using both IPv4 and IPv6, and compare their relative round trip time (RTT) to the experiment’s server and back. What we are looking for are those instances where the network’s delay diverges between the two protocols and the delay experienced by one protocol is notably different to that delay along the other path. What we are after, informally, is an answer to the question: “Is IPv6 faster or slower than IPv4?
The way delay is measured is to once more take the initial TCP SYN handshake (Figure 1), and measure the elapsed time between the reception of the opening SYN and the ensuing ACK. The measurement script used in this experiment asks the endpoint to fetch a set of URLs including a V4-only and V6-only URL. The set uses a common unique DNS name component, allowing association of the common unique name component with an IPv4 and an IPv6 source address for the endpoint. Given the SYN RTT measurements for every endpoint, it is then possible to associate the appropriate pair of measurements (IPv4 and IPv6) for the endpoint and their difference.
What we have is two measurements for the RTT between the same two endpoints (Figure 8). There are a number of reasons why these two RTT values might differ. It could be that the network paths may differ between the two protocols. This is going to be the case when the IPv6 connection uses 6to4, as 6to4 involves a third party tunnel relay, but even with conventional unicast IPv6 and IPv4 are routed as distinct protocols and different network paths for IPv4 and IPv6 are not unusual. Even when the two paths are precisely the same, the RTT measurements may differ slightly. Older routers passed IPv4 packets through an optimised switching path, while IPv6 packets were switched by passing the packet through slower software based processing. This is far less prevalent today, but may still be the case in some instances.
Another factor is transient queuing delay. As can be seen with standard ping measurements on all but the most lightly loaded of networks, the amount of time a packet spends in a queue may vary between successive ping tests, and the measurements of the TCP SYN time are analogous to a ping measurement, using TCP rather than ICMP. To try and compensate to some small extent to this queue-induced jitter, this experiment uses the lowest RTT seen if there have been multiple TCP connections between the same two endpoint addresses.
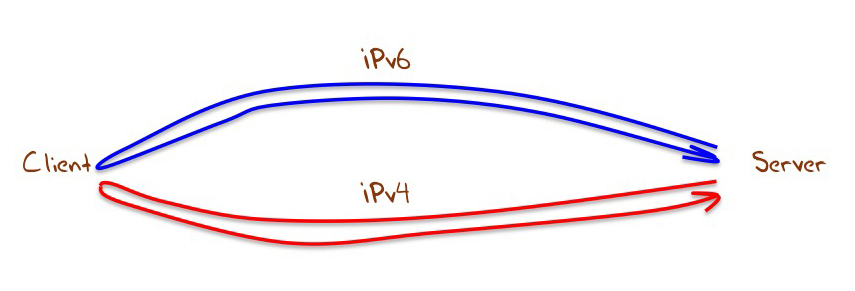
Figure 8 – TCP SYN RTT Measurements
This relative RTT measurement was conducted in March 2012, with the result shown in Figure 9. Points to the right of the centre line are where IPv4 is faster, and to the left where IPv6 is faster. The pairs are differentiated whether the IPv6 address shows as a Teredo address, a 6to4 address, or a unicast address. The unicast IPv6 measurements clustered around the midpoint, with a smaller number of samples where the IPv6 time was up to 50ms slower than the IPv4 equivalent. IPv6 tunnelling was predominately slower than IPv4, though what was surprising was the number of cases where the tunnelled measurement was faster then IPv4.
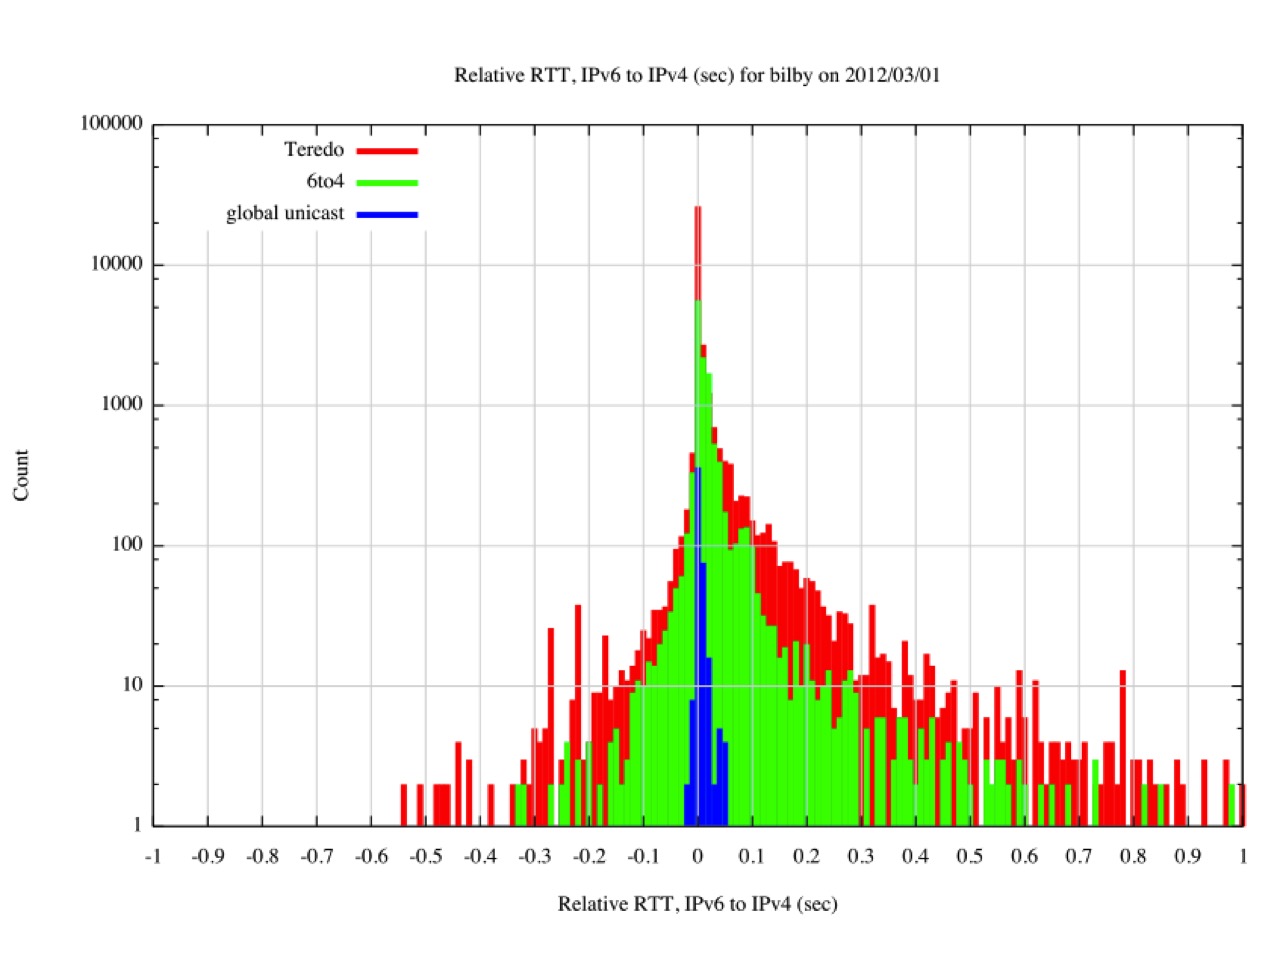
Figure 9 – Relative RTT Measurements – March 2012
The same measurement was performed in November 2015, and the results of this measurement are shown in Figure 10.
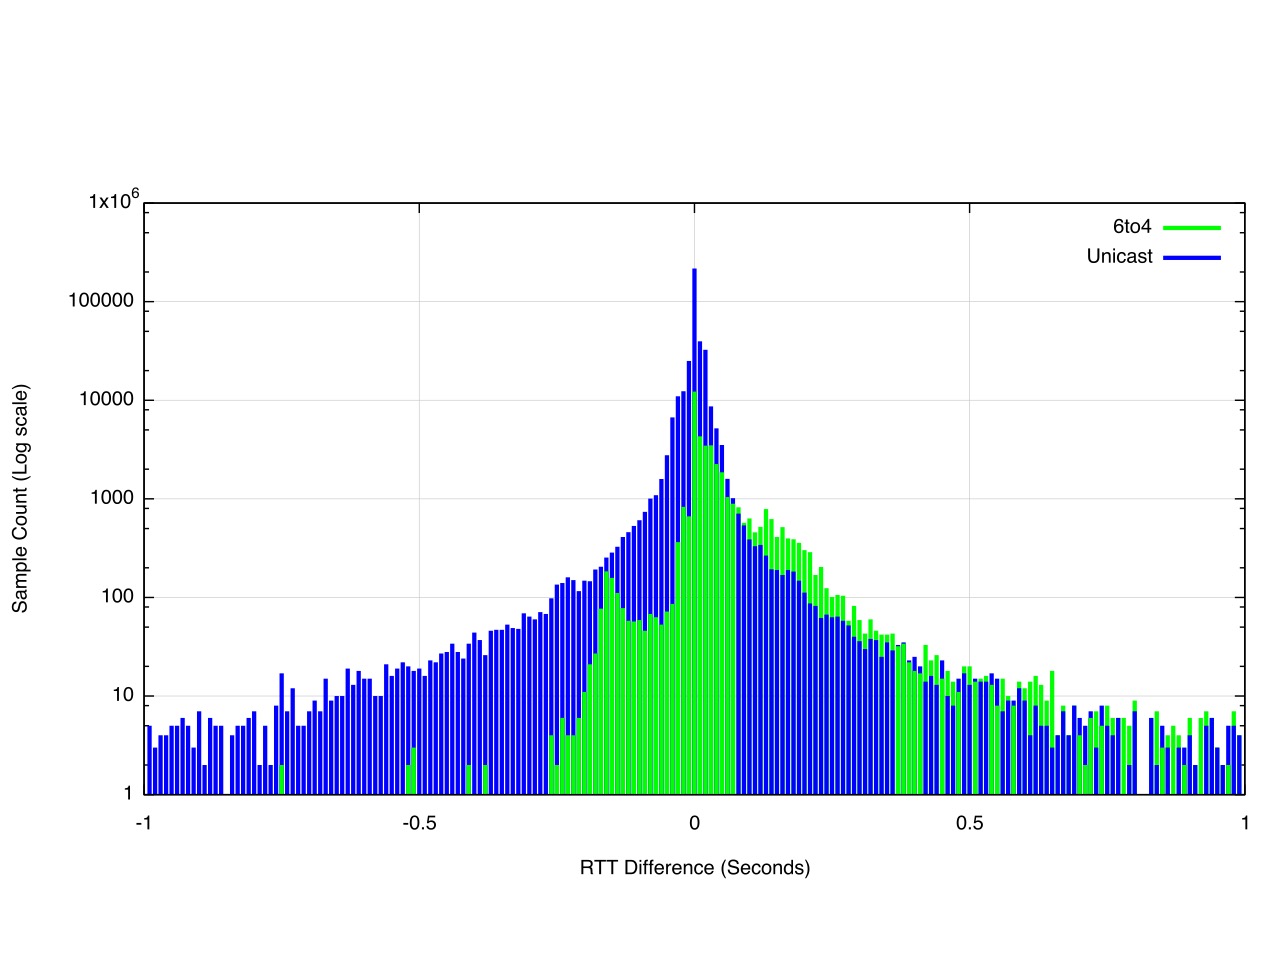
Figure 10 – Relative RTT Measurements – November 2015
Due to the very small number of measurement points, Teredo is not shown in this figure. What this figure shows is that 6to4 is slower than IPv4 in most cases. Unicast IPv6, on the other hand, is more even, with IPv6 being seen to be faster than IPv4 about one half of the time.
This distribution of time measurements is shown in a cumulative distribution plot of the relative time differences (Figure 11).
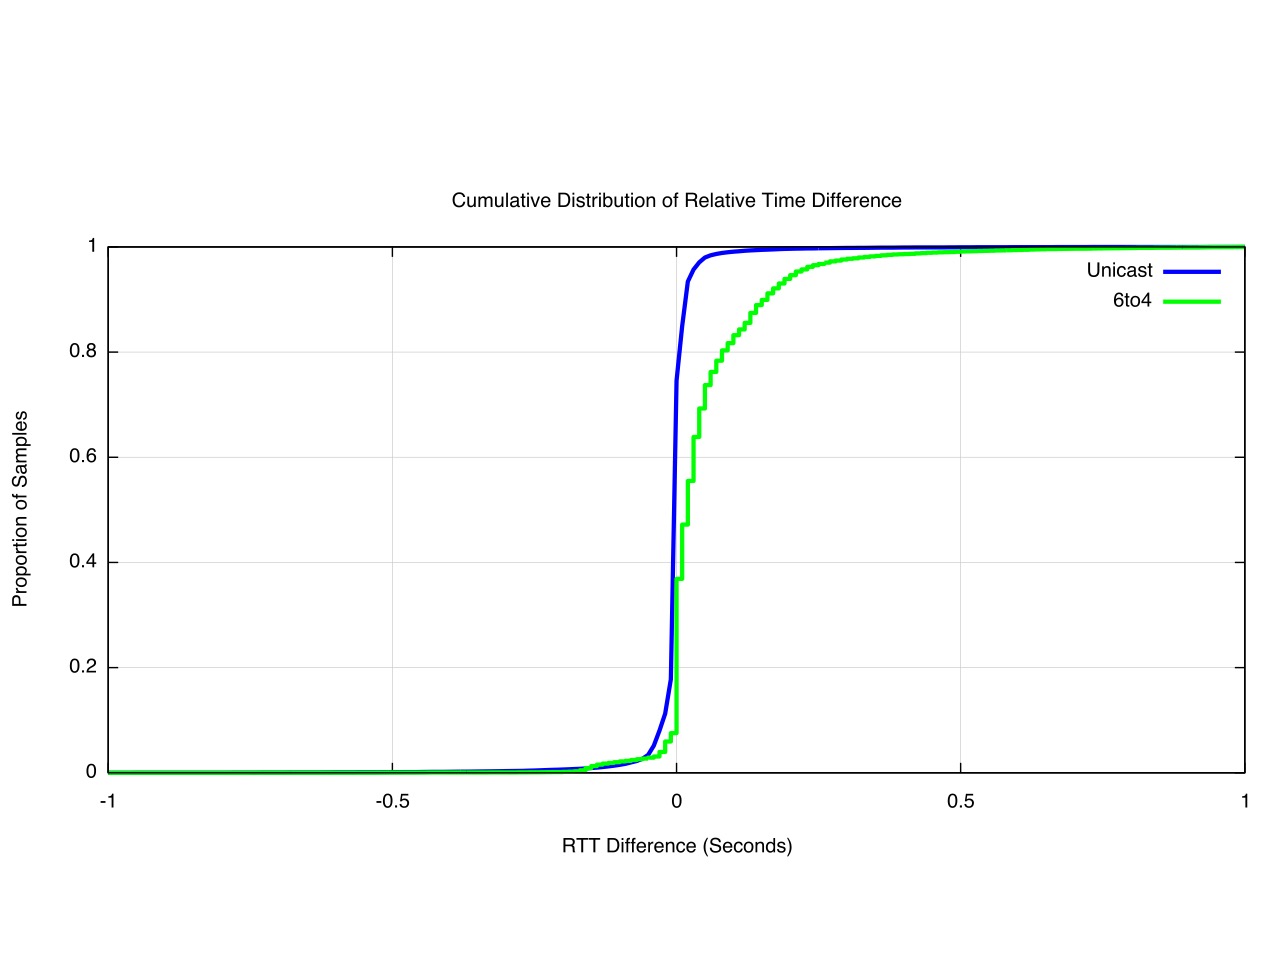
Figure 11 – CFD of Relative Time Differences – November 2015
Using a measurement granularity of 10ms, its evident that the IPv6 RTT is within 10ms of the IPv4 RTT for 60% of the measurements, and is slower in 20% of the measurements, and faster also for 20% of the time. The 6to4 case shows that for 65% of the time the 6to4 RTT measurement is more than 10ms slower than the paired IPv4 measurement.
We can look at the centre point in further detail by using a finer level of measurement granularity, and Figure 12 shows the midpoint using 0.1ms granularity of measurement.
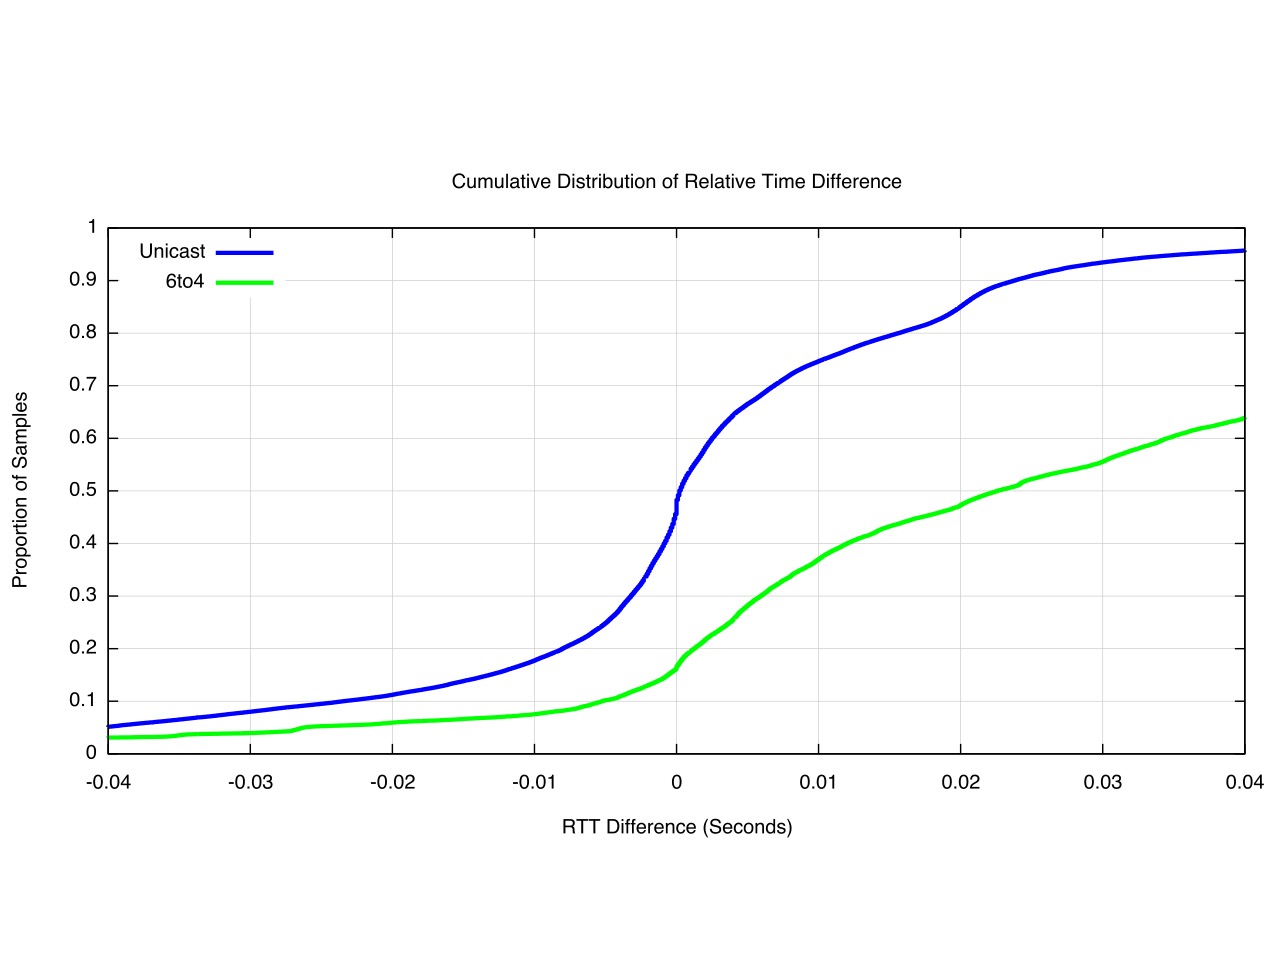
Figure 12 – CFD of Relative Time Differences – November 2015 (0.1ms granularity)
The Unicast IPv6 RTT is faster than IPv4 for 48% of the time, but more than 10ms faster only 18% of the time. Similarly, the Unicast IPv6 RTT is slower than IPv4 for 51% of the time, and is more than 10ms slower 25% of the time.
The clear message is that 6to4 is a very suboptimal way of access IPv6, and the message in RFC 7526 , published in May 2015, to just stop doing it is very good advice indeed. So how prevalent is 6to4 in today’s IPv6 world?
One last graph, Figure 13, shows the relative level of use of 6to4 by dual stack equipped devices. There is still a lot of 6to4 out there, but the good news is that it is declining in relative importance as the volumes of unicast IPv6 increases. Over the year we have seen it decline from 45% to 10% in mid-November, so perhaps this is a problem that will all but disappear in relevance in the coming months.
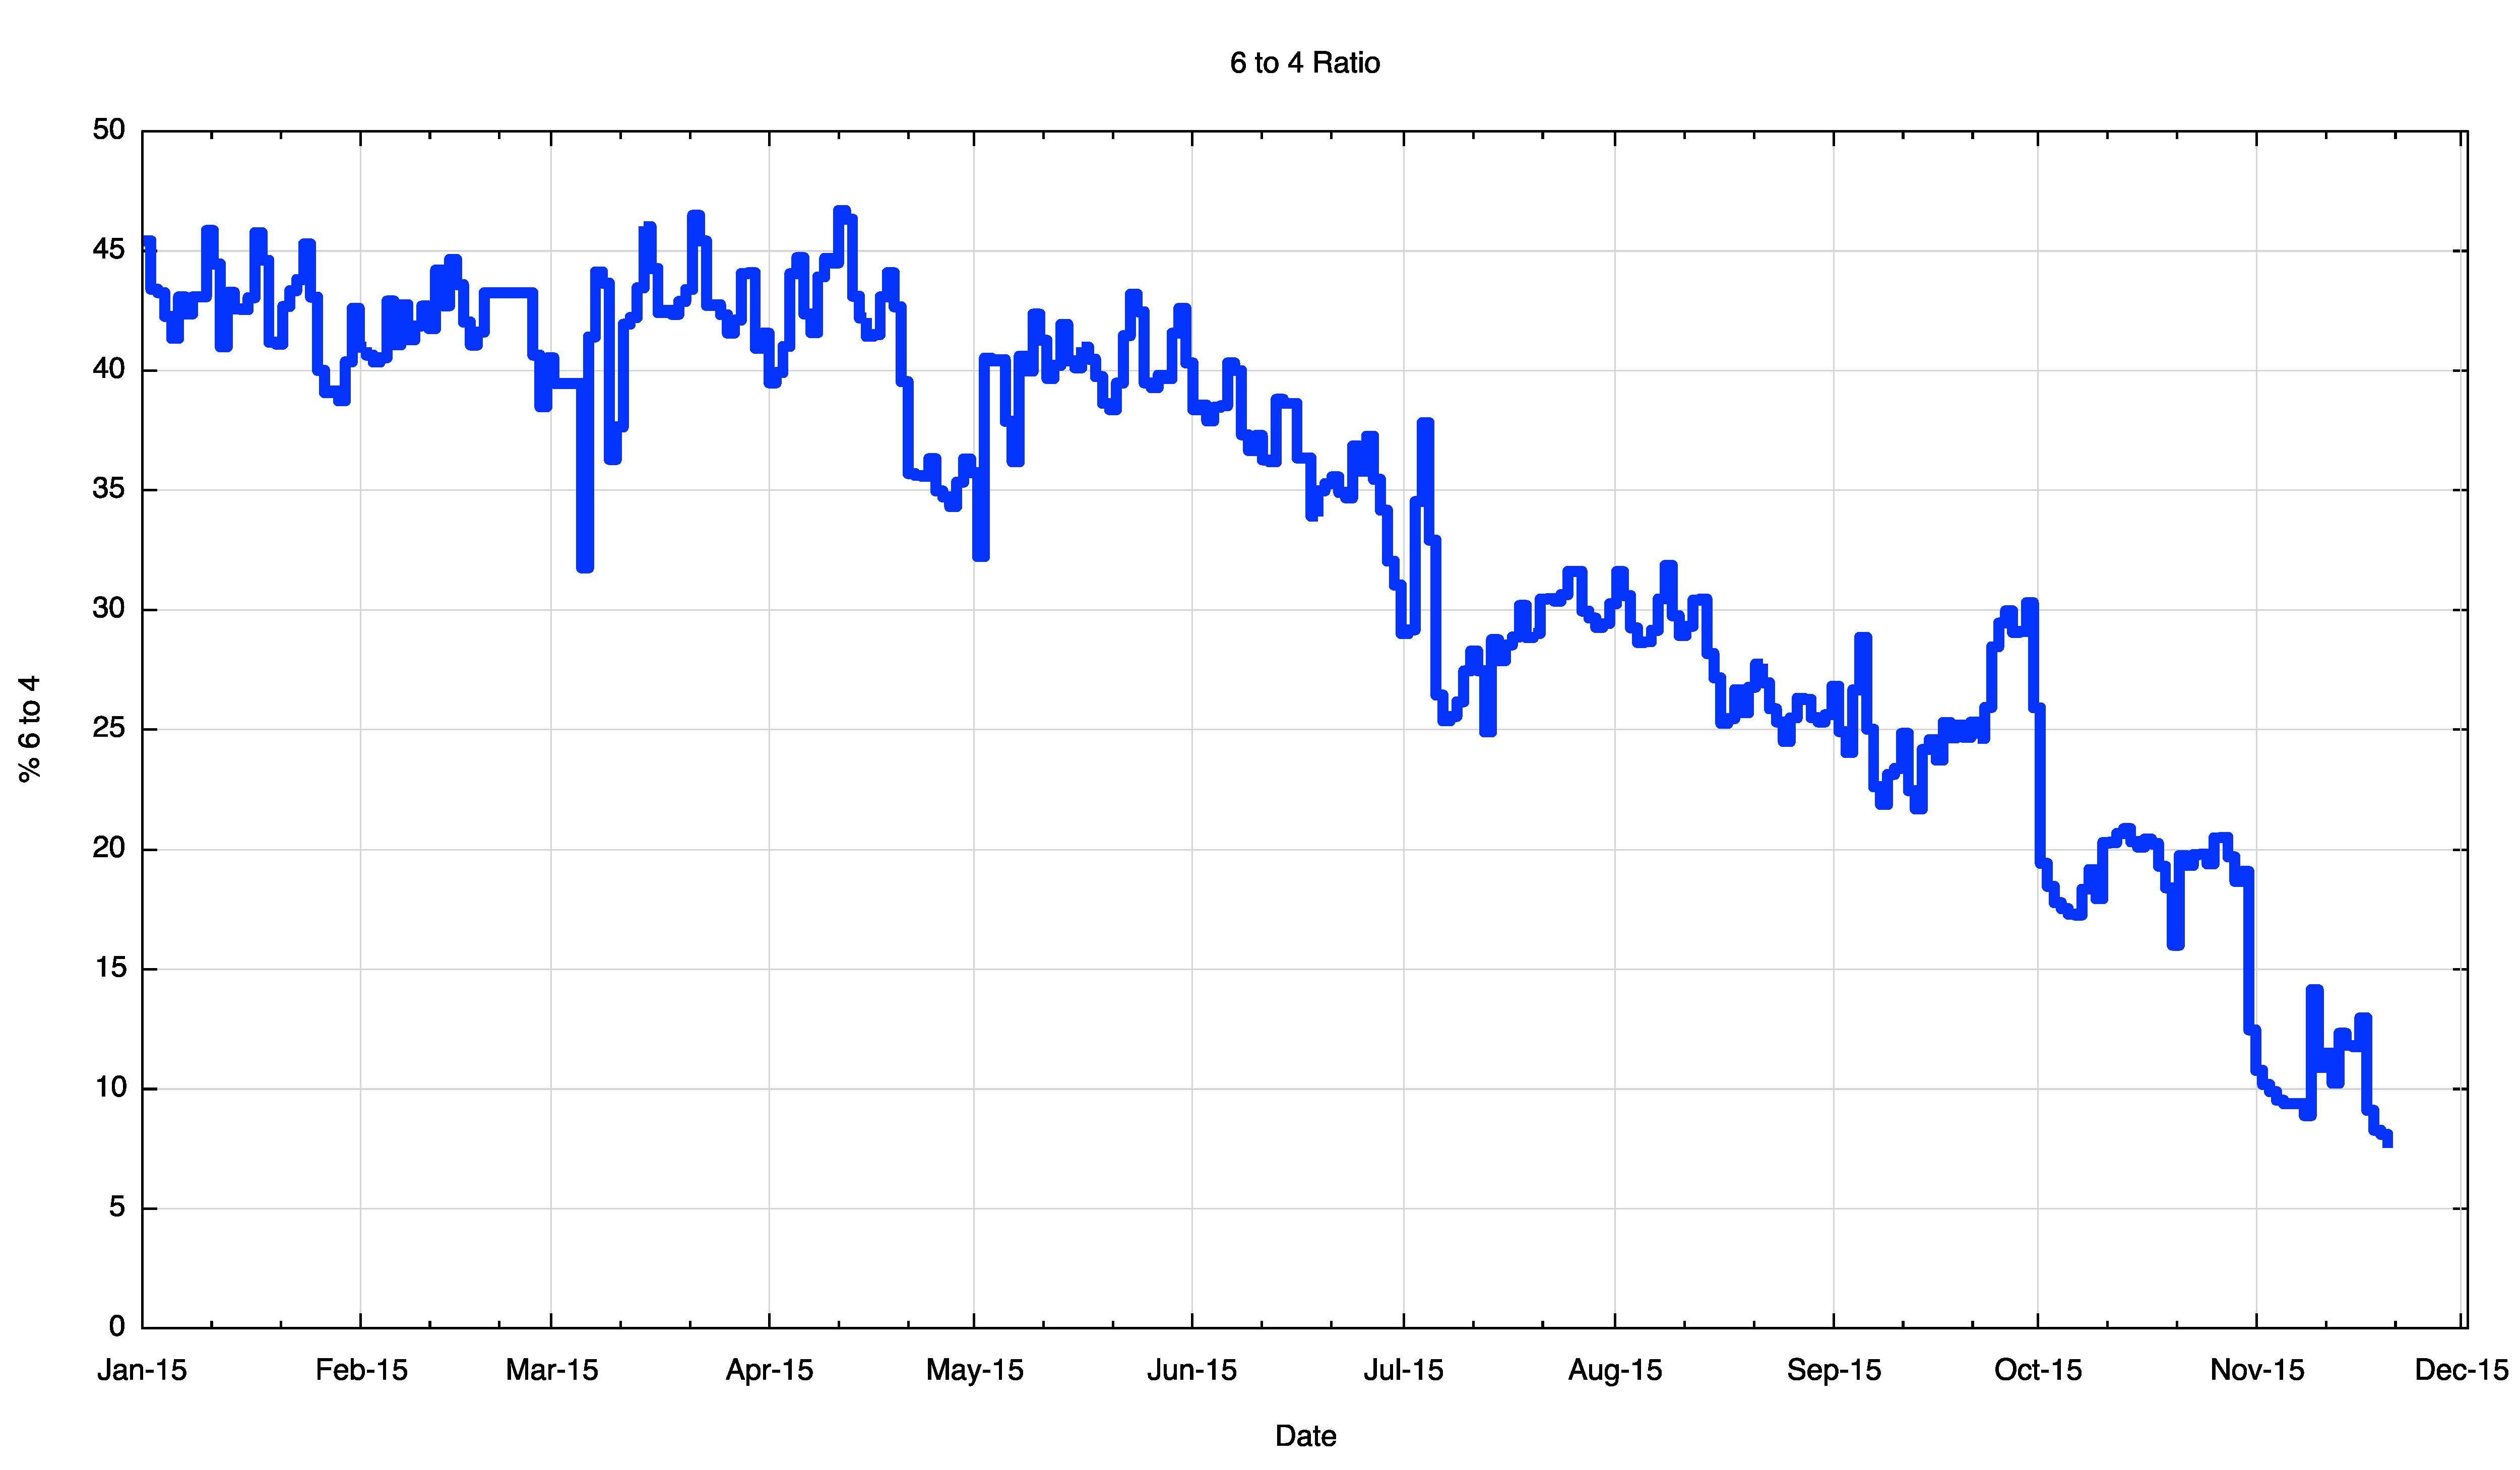
Figure 13 – Relative Proportion of 6to4 IPv4
Conclusion
What can we conclude about relative performance of IPv6 to IPv4 from these measurements?
These measurements show that in a large set of 1:1 individual comparisons where the IPv4 and IPv6 paths between the same two dual stack endpoints are compared, the two protocols, as measured by the TCP SYN round trip time, are roughly equivalent. The measurements are within 10ms of each other 60% of the time.
While the connection performance is roughly equivalent once the connection is established, the probability of establishing the connection is not the same. The current connection failure rate for IPv4 connections was seen to be some 0.2% of all connection attempts, while the equivalent connection failure rate for unicast IPv6 is nine times higher, at 1.8% of all connection attempts.
There is still some scope for improvement here.
Note: This article was first published on the APNIC blog and was also presented at RIPE 71 .


Comments 0
The comments section is closed for articles published more than a year ago. If you'd like to inform us of any issues, please contact us.