For many years I have been the leader of the Research and Development team at the RIPE NCC leading a dedicated team of thinkers to support the RIPE community by providing network research, data analysis and prototype tool development and services including RIPE Atlas and RIPEstat. As of 2023, I'm … More
RIPE Atlas is 10 years old! To help mark the occasion, alongside the virtual events we have planned over the next two weeks, we'll be posting a series of stories surrounding the development of RIPE Atlas.
Check here for daily instalments!
Data Streaming
In early 2014, one of our engineers was playing around with some new technologies and thought: "huh, maybe I can connect this Atlas result queue here with a Redis store over there and put a few lines of node.js frontend on this machine... what can possibly go wrong?" In that moment, the prototype of what became result streaming was born.
In a different universe (well, room), we worked on the so-called one-off measurements - the kind where the user doesn't want to measure on a regular schedule, but instead only once on a "fast path". What this really means is that these kinds of measurements end up in a slightly different channel. The controllers notify the appropriate probes as soon as the measurement is scheduled (which may be in the future), while the probes maintain a separate queue of these instead of adding them to their own "crontab". The two mechanisms coexist in peace, meaning neither of them has priority over the other. The end result is that the one-off measurements are quicker to execute and report on (but not applicable when probes are disconnected and are more expensive to run) while regular measurements are more suited for periodic checks (and are cheaper to do).
Naturally, we combined the streaming prototype and the one-off measurements, tweaked the system here and there, and saw results appearing mere seconds after specifying the measurement. It was a moment to celebrate. Which we did!
Of course it took more work to stabilise the solution and make it more scalable but what you get today is basically the solution that was introduced back then. Handling peak usage is still a challenge, but we expect that the service is here to stay.
It's worth noting that the RIPE Atlas streaming concept / solution was later applied to make RIS data available in real-time, giving birth to RIS Live. Even though RIS Live has a lot more result filtering logic (ASNs, peers, more and less specifics, etc. can be filtered in real time), under the hood the two systems use the same idea: take results off the queue and serve them to whoever is listening at the moment while doing real-time filtering.
The Value of Metadata
metadata (noun): data that provides information about other data
In a system such as RIPE Atlas, there's much more going on than just pushing out commands and receiving results. The inner workings of the system can also provide a signal; sometimes quite a useful one, if one knows how to interpret it.
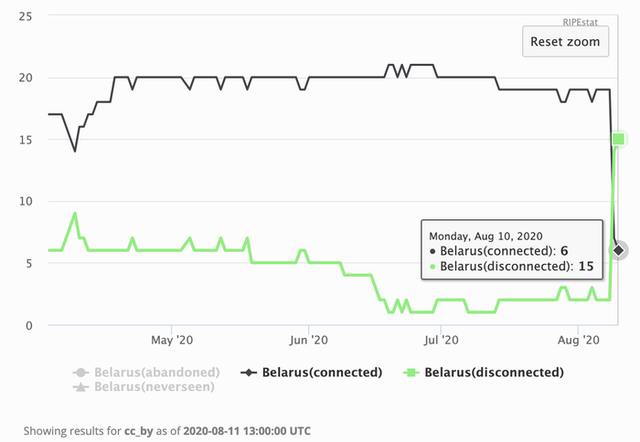
For example what does it tell us when of a bunch of probes, that are otherwise measuring away quite happily, disappear at the same time? In other words the information about whether these probes are connected or not changed similarly. It can tell us two things:
They were controlled by the same piece of machinery, and that piece is unavailable at the moment. Perhaps the server was rebooted. Thus, the probes disconnect at the same time. While this is unfortunate, it doesn't really carry value for the purposes of observing network behaviour.
They live in the same network (ASN, prefix) or perhaps country... and something changed there which made the probes behave the same way. This can tell us something interesting: our most recent example is the Belarus outage.
It's difficult to distinguish the two cases unless we know enough "metadata". In the above cases, knowing where the probes are physically located, as well as which ASN and prefix they belong to, helped in figuring out what kind of events we were looking at. Another example is a power outage around Amsterdam many moons ago -- which happened precisely during a hackathon, so people were really curious about how our probes behaved in the area. It's reasonable to assume that machine learning algorithms could also pinpoint interesting events in the data stream, purely based on metadata, that humans may otherwise overlook.
Periodicity is also a signal that can come handy. Researchers have used our metadata to analyse how DHCP leases are used by some ISPs to artificially force home connections to different IPs every day (curiously, only on IPV4, IPv6 sometimes remained stable...). We can only speculate why this is (or was) a business practice, nevertheless the data is available to support the findings.
Besides probes, measurement metadata can have its own stories. How many measurements are scheduled, to which targets, by whom, how often, are there any "hot targets", etc. - all this can provide insights into how and why people are using the system. Research paper(s) have looked at this too!
Measurement scheduling uses data about probes to find the best candidates when scheduling measurements. The system supports may built-in filters (probes in ASN, country, prefix, having or not having tags, etc.) and we encourage our users to use filters on the the probe archive as a fallback for more exotic selections.
Internally, we also use metadata to identify operational problems (e.g. if we suddenly fail to receive the expected amount of results, or what's the status of our "GDP" each day; i.e. how many credits have been generated or consumed). The system also has an input filter to reject results from probes that think they live too much in the past, or indeed in the distant future, because of internal clock issues. Information can appear in many shapes and forms!
Probe Behaviour – Herding is Sometimes Hard
As you can imagine, when you have devices in thousands of different networks, you can observe all kinds of curious behaviour.
The simplest case is if we just don’t know what’s going on, purely because we don’t get any data from the probe. Examples include firewalls (unintentional, or even previously unknown ones), broken DHCP servers and such. In such cases we are unable to assist the probe hosts, as we ourselves don’t get any clues about what’s wrong and have no means of contacting the probe ourselves.
Broken or funky DNS resolvers produce a whole different class of cases. We set up the probe code such that on initial connection (towards the so-called registration servers) they randomly try either hostnames, IPv4 literals or IPv6 literals. Thus, if at least one protocol works, then we will receive some life signs on our end, which can help tremendously in fixing the problem. Conversely, each probe sends an “SOS” message upon boot, which is really just a DNS lookup to a special zone/name. If we get this, but not the connection attempt over IPV4 or IPv6, then we suspect firewall issues.
Quiz question again: what is a major source of probes going offline after a long and successful life? Answer: stale static network configuration. See, there was (is?) sufficient demand to let hosts assign static addresses to their probes. This is a complicated process since the probes are “headless”, you cannot directly tell them what to do, but it can officially be done. But then the network changes and either the IP address doesn’t apply any more, or the DNS resolver doesn’t. After all it’s easy to forget an install-and-forget device :-)
Assuming we do get reports from the probe, there are many, many curiously bad cases:
Sometimes probes submit too much data. Way too much data. Like, the same data over and over again, pushing out as much as they can as many times as they can. This does happen for example if the probe is unable to notice that it did successfully send the data and now it should forget it.
Sometimes probes submit too little data. For example they are up and running, so supply basic health information, but never submit results. Maybe they are hungry and just eat up crontab entries? Perhaps. But more likely there’s a bug in the measurement code, and just in the right network conditions, the measurement process dies. Meaning we can tell the probe what to do next, and it will listen to us, but it’ll just never do those things. Goes to la-la-land instead.
Clocks are weird. Even in the era of NTP, clocks can be off. Cloud providers have their own stories… and so do we. As it happens, there are cases when probes cannot reach NTP servers. So clocks drift. For the purposes of RIPE Atlas measurements, precise absolute clocks are not very important. For the measurements in RIPE Atlas it’s enough to know at which second a measurement was started, as long as the measurement itself uses relative clocks; i.e. something that’s based on CPU cycles or such. But what if the clock is way off? For example, years in the past, or in the future? The infrastructure cannot tell when a particular measurement was really done, so the best it can do is to reject the obviously wrongly timed ones. The probes in turn have a mechanism that checks their local clock against the reference time provided by the infrastructure (they do make HTTP calls regularly, after all) and if the difference is too big then they adjust their clocks to match the reference time. This is imprecise, but again, fits the purpose of the system perfectly.
We have mechanisms to track how much data (and from which timeframe) we expect a probe to deliver. Deviations from this are flagged and a decision mechanism is applied: if the probe looks really sick then we assign it to a special controller that is built to deal with the unexpected behaviour. This mechanism lets us keep the well-behaved probes on the network without too much hassle.
A completely different category is when we observe protocol violations. File system corruptions or hacking attempts can both lead to these. The system is less tolerant towards probes that show these kind of errors.
Do probes ever deliver bad results? Obviously, some of them do. Every decently sized measurement network is susceptible to bad results. It’s likely good advice to be vigilant when processing results: be prepared to handle statistical anomalies. (A relevant anecdote: there used to be a probe in the network for a while, which was <1ms away from every target, using every kind of measurement. Faster-than-light networks are evidently possible!)
APIs, APIs, APIs
Interaction with RIPE Atlas was originally only possible via the UI. Some of you may even remember the early ExtJS based UI pictured here?
Of course, our primary target audience was a crowd that loves automation, scripting and tooling, so we were keen to add an API to the system. And then we added one more. Then another, and another… Soon we had a whole range of APIs that you could use to take care of anything from measurement management (new, start, stop, modify, search, etc.) to results (by one probe, one measurement, one day etc.), to probes (searching for, mostly) to credits to applications to ambassadors, etc.
The first (v1) API was built using an API framework that slotted nicely into our codebase and also seemed like the option that had the largest probability of success at the time. In a short while, this turned out to be less true than we desired and so we had to change our ways. Taking the opportunity to make changes based on how we saw our users using the API, and improving on a couple of aspects like authorisation, data serialisation and so on, we decided to revamp the API into what became the v2 release. By this time a number of users were already relying on the v1 API, so for a long time we provided a shim layer that converted v1 calls into the equivalent v2 versions while internally we abandoned v1. Even though this was suboptimal from the maintenance point of view, we wanted to give time to our users to migrate.
We also built a number of tools to help users interacting with the API:
Magellan is a CLI tool to interact with the system
Cousteau is a Python package to let users build their own scripts and abstract away the API details
Sagan is parsing library for RIPE Atlas measurement results
We are aware that several members of the community also wrote theirowntools, built on top of the APIs. This is a very encouraging development!
APIs are not always the best choice though, especially if someone is interested in a large number of results, or perhaps “everything”. They also can have difficulties with historical queries such as “what was the state of probes in Hungary on 2015-03-01?”. This is why we offer alternative solutions, such as:
The probe archive which contains the dump of our probe data per day since 2014
The measurement archive containing the metadata about our measurements since the beginning of time
Daily result dumps containing results of all public measurements, in a 30 day rolling window
Results in BigQuery to analyse results on a massive scale to your heart’s content
The Introduction of Anchors
By 2014 the Test Traffic Measurement Service (TTM) was in desperate need of a revamp. Even though it offered unique properties like the ability to do very precise one-way delay measurements, it became evident that scalability and operation issues (like the difficulties of installing a reliable GPS receiver in a datacenter…) were major issues. RIPE Atlas was designed with the ability to eventually replace TTM in mind, even though some sacrifices (like the abandonment of one-way measurements) had to be made.
Of course, the tiny probes are not up to the task to take on TTM duties. And as many of them are behind NATs, they're not suitable anyway, because this makes them particularly bad measurement targets. Hence the birth of RIPE Atlas anchors - basically hybrids of probes and TTM boxes. They are (well, were, as you will see later) rack mounted small PCs, with a proper OS. They have the probe component as a software package pre-installed, so they can do everything a probe can. And they're also willing targets for measurements: they offer very basic services like no-brainer HTTP(S) and DNS servers, and the hosts agree to the potential bandwidth requirement.
Once we have measurable and willing targets, the measuring fun begins! The anchor hosts get, free of charge, a number of benefits: the system puts all of them in a measurement mesh, meaning every anchor measures the connectivity to every other anchor. Each anchor is also targeted by a few hundred regular probes so there’s a view from the edge of the network too. By the way, trivia question: did you know why they are called anchors? Perhaps now you can guess… because they act as stable anchoring points for probes. Their “movement” inside the topology can be observed and accurately mapped by looking at the measurements against them.
Just like the probes, the anchors have been through a few hardware generations. Each lifecycle replacement is, and continues to be, a big event for everyone involved. After long discussion about pros and cons, around the end of 2018 we officially introduced the “VM anchor” version, where instead of racking up a PC, the host instead provides a VM that meets some minimum requirements. The behaviour is otherwise the same. This also opened the door to have anchors in the networks of popular cloud vendors like Amazon AWS or Google GCP as well as some other not-so-popular ones. You may have heard that a lot of businesses depend on services hosted in these clouds – and many operators are therefore curious about measurements against them. (Call for action: please join the RIPE Atlas anchor VM cloud crowd! Smaller clouds, CDNs are also welcome!)
On final thing about anchors: they are actually managed by the fine operations people of the RIPE NCC. They take care of everything to do with setup, upgrading, patching, and so on. As you can imagine this is quite a headache on the scale of the network and especially considering the diversity of our hosts, their networks and … other peculiarities. As we move forward, this is an area of future improvement we're certainly going to have to look at.
Infrastructure Evolution
Collecting, storing and retrieving results started simple enough. Probes sent results to controllers whenever they felt like it. Controllers batched these up into 1 to 5 minute buckets and sent them on to "brains" (higher level components that had access to the central database) over a just-in-time SSH channel. Brains inserted them into the database (the Database). Life was simple enough.
Of course this didn't scale well, so once we hit a limit (one we didn't imagine we'd be hitting so soon) we started experiencing difficulties: transactional errors when inserting, backlogs building up, communication errors, being unsure if the results really ended up in the DB, etc. Inserting that many millions of records into the database at that time on a tight budget was not serving the need any more.
This led to a few major infrastructure changes that are still with us to this day.
The first is that we added message queuing to the infrastructure. This approach lets each component send messages to other components, and be sure they arrive - if they don't, the queues will buffer and retry automatically. We started with RabbitMQ, which is still a fine piece of software if you know your way around it. Then later on we switched to Apache Kafka, which is kind of the industry standard nowadays. We use queues for multiple purposes - one channel carries results (in the probes-to-storage direction), another carries commands (in the centrum-to-probes direction), and yet others carry metadata that needs to flow inside the hierarchy of infrastructure components.
The second is the evolution of infrastructure components. I mentioned the use of the so called "brains" earlier. These are components that make decisions (how to schedule measurements, what other things to do) based on user input, probe availability, system status, etc. Over time we built more and more tasks that took care of things that just needed to get done (housekeeping, recovery from errors, statistics, batch operations,...). Since scheduling measurements is also considered a task, this led to the evolution of "brains" into "workers". We have a number of these available now, all competing for tasks to do - which are of course taken off the task queue. In turn, this helps us keep the infrastructure horizontally scalable as the original design goal guided us.
The result store also got revamped a long time ago such that all the results are stored and indexed in a Hadoop/HBase backup. As long as the storage layout is defined correctly, HBase provides a solution to retrieve almost any particular record, or a sequence of records, very efficiently. It also provides storage redundancy while maintaining good-enough scalability. After all, we're inserting about 900 million records every day! Managing such a beast is of course far from trivial, which is one of the reasons why we're evaluating alternative solutions in the cloud, such as Google BigQuery.
All in all, the infrastructure components were designed to horizontally scale and we see that the network could grow to accommodate a much larger footprint in the future.
Probe Evolution
For a number of reasons, at the beginning, we really wanted to have hardware probes. That said, it was surprisingly hard to find hardware cheap, small and reliable enough to do what we wanted to do. Our v1 probe ended up being a Lantronix XPortPro, with 8MB RAM and 16MB flash storage. That's megabytes, not gigabytes. It also came complete with a CPU that was not designed to do what we needed it to do - for example, it lacked an MMU (memory management unit) meaning that the precious 8MB of RAM would fragment to ever smaller chunks over time, eventually getting to a point where there wouldn't be any big enough to start new tasks.
Overcoming the limitations of the v1 probes was quite a challenge. And this in spite of the fact that we were using ucLinux, which is tailored to work in such cases. After some time, though, the probe team came up with a brave solution: the code should work without forking any processes, thus avoiding a lot of memory fragmentation. This quickly led to the use of libevent and the need to write applicable measurement code ourselves.
Not much later (and partially to address our pleas), a new version of the XPortPro module came out and became our v2 probe, with a very generous 16MB of RAM. This helped us stabilise the devices; although we were thinking we'll be able to achieve at most a couple hours of continuous uptime, we ended up with up to a couple of months. We were happy!
When deciding on the hardware for the v3 probe, we wanted to have something off-the-shelf in order to drive down unit costs. We found the TP-Link MR3020, which is originally a travel wifi router with a USB port on its side to accommodate a mobile stick for data connectivity. We "repurposed" this to host a USB storage instead, which allows the devices to store virtually infinite amounts of results even if they are otherwise offline. (This is particularly useful if you want to observe what networks look like "from the inside" in case of a disconnection.) These devices worked relatively well - but after a few years the 24/7 operation and the increased power budget imposed by the USB stick they started to show signs of instability. After users had to go through the pain of finding better power adapters and replacing USB sticks, we saw that the future has to bring a better solution; namely a device that works with on-board storage.
We found this in the form of a Raspberry Pi clone, the NanoPi NEO Plus2. We had to build proper casing for the v4 probes ourselves, but otherwise this was still off-the-shelf enough and met our other needs. With these devices, probe initialisation (uploading initial firmware, key material generation, labelling, etc.) is still done by us from our office.
Nowadays, in order to prepare ourselves for the potential unavailability of these devices, and having a preference for a more predictable and reliable local supplier, and wanting to avoid having to manually process each device ourselves, we're evaluating a new device to become v5. Watch this space if you are curious to know more!
By the way, many of our now-10-years-old v1 probes are still alive. Amazing feat, considering what they do using their flash storage...!
A lot has changed in the last ten years when it comes to virtual machine technologies and the processing power available on various home devices such as routers and idle Raspberry Pis. The distribution of hardware probes comes with its own logistical challenges too. These facts made us re-evaluate the strict need for hardware probes - and led to the release of software probe packages. The challenge here was to re-engineer the parts of the probe code, namely the parts that took advantage of the fact that they didn't need to coexist with other software. Once this was done we could properly open-source everything that runs on probes.
The Early Days of Protocol Design
Back in 2009, in our old office on the Amsterdam Singel, a team of us were busy working out what the infrastructure for our still yet to be named measurement network would look like.
One of the main questions, among many at the time, was how to maintain a two-way channel to our probes. We wanted this to be truly real-time bi-directional - the system should not have to wait minutes (or more) when there's work to do and probes waiting to start doing it right away. Equally, the probes should be able to report their results as soon as possible, without waiting for an arbitrary synchronisation event.
Nowadays the answer would be simple. Use WebSockets! They would have worked just fine, but 10 years ago they weren't really an option. The protocol wasn't yet fully developed, much less supported on "regular sized machines", and even less so on resource constrained devices. So, we looked at a different solution: probes make SSH connections into the infrastructure. This works easily with NATs (which we set as a requirement) and they have the ability to establish channels in both directions: the so called "local- and remote port forwarding". By fiddling with how we allocated appropriate TCP ports on the controlling infrastructure, we came up with a solution where the probes can talk immediately to the controllers (using local port forwarding) and vice versa (via remote port forwarding). The probes submit results via a "local" HTTP port, and receive instructions via a "local" Telnet connection. All this is done over secure, encrypted and mutually authenticated channels. This solution worked good enough and, in fact, it's still in use today.
The SSH trick also had a nice side-effect: the probes don't have to listen to anything publicly -- making them much safer to use by virtue of not providing any services that can be attacked. For some reason SSH was pretty relaxed in terms of controlling what rules its clients have to obey when it comes to port forwarding, so we had to add our own patches to the implementation. Fortunately such changes more recently became part of the official release.
We also defined a simple protocol to be used between probes and controllers: probes say "INIT" when they connect, then "KEEP" to ask for a sustained connection. Of course we had logging about what's going on on this channel very early on, so imagine our surprise when, one day, a probe failed to properly connect and eventually said "I_AM_AN_ENGINEER_LET_ME_IN".
We figured it was unlikely that our tiny devices gained that much consciousness in such a short time -- and sure enough when we began conversations with the probe host we learned how they were able to achieve such a feat. We began to believe more in the existence of morphogenetic fields when they pointed out weaknesses in our design that we were also in the process of implementing...
For many years I have been the leader of the Research and Development team at the RIPE NCC leading a dedicated team of thinkers to support the RIPE community by providing network research, data analysis and prototype tool development and services including RIPE Atlas and RIPEstat. As of 2023, I'm … More
For many years I have been the leader of the Research and Development team at the RIPE NCC leading a dedicated team of thinkers to support the RIPE community by providing network research, data analysis and prototype tool development and services including RIPE Atlas and RIPEstat. As of 2023, I'm … More
For many years I have been the leader of the Research and Development team at the RIPE NCC leading a dedicated team of thinkers to support the RIPE community by providing network research, data analysis and prototype tool development and services including RIPE Atlas and RIPEstat. As of 2023, I'm … More
For many years I have been the leader of the Research and Development team at the RIPE NCC leading a dedicated team of thinkers to support the RIPE community by providing network research, data analysis and prototype tool development and services including RIPE Atlas and RIPEstat. As of 2023, I'm working as a principal engineer in order to assist the CTO and the RIPE NCC's information services.
Comments 0
The comments section is closed for articles published more than a year ago. If you'd like to inform us of any issues, please contact us.


Comments 0
The comments section is closed for articles published more than a year ago. If you'd like to inform us of any issues, please contact us.