
RIPE Atlas probes actively measure Internet connectivity through a variety of measurement types. In this article, we take a closer look at what probes can tell us about outages.
Last month, we shared our first glance at the recent Internet outages in Belarus. As we reported then, we observed a marked drop in the number of Belarus networks visible in BGP during the time of the outages. We also saw a number of RIPE Atlas probe disconnections over the same period.
In following up on this, one of the things we've been looking at is how information from probes can help us gain a better understanding of outages. Here, we share some observations and look at some of the recent work we've been doing to visualise the data we have available on these kinds of events.
RIPE Atlas Probe Disconnections
This plot gives an overview of the situation for multiple probes in multiple ASNs around the time of the Belarus outages.

Graph of RIPE Atlas probe disconnections per Probe ID/ASN from 6-27 August (source)
We see that a set of probes located in different ASNs became disconnected on 9 August and stayed that way until 12 August. Probes located in AS6697 (held by Beltelecom, national telecommunications company for Belarus) did not, even though they do seem to have encountered a slightly higher disconnect rate than usual during that period (on zooming in you’ll see a higher than usual frequency of small white gaps).
We get a similar picture when we look at the LatencyMON results for a traceroute measurement (#5030) carried out using UDP by probes affected by the outage. The red dashed areas indicate a period of 100% packet loss.

LatencyMON results for RIPE Atlas measurement #5030 (carried out using UDP) performed by several of the affected probes. Dashed lines represent the positions of samples affected by packet loss. A protracted packet loss of 100% appears as a red dashed area.
So, the probes disconnected from RIPE Atlas. And since probes communicate with to the RIPE Atlas infrastructure via controllers over TCP port 443, this suggests they were unable to connect over TCP during the outage. In addition, the LatencyMON results above suggest that these probes were also unable to connect over UDP. That said, it turns out these probes were still able to send low level Internet control messages. That is, they were able to send pings over ICMP. This is useful, as it helps us see what was going on with probes inside the outage as it happened.
The plot below (left) shows LatencyMON results for ping measurement #1030. In contrast to the previous image, here we see the same set of probes pinging happily during the outage. Interestingly, things are different when we look at an IPv6 ping measurement #2030 (below right). Here we see 100% loss in the pings, which is consistent with the fact (discussed in the previous article) that 50% of the IPv6 prefixes disappeared for almost three days.

LatencyMON results for RIPE Atlas ping measurements #1030 (left) and #2030 (right) performed using IPv4 and IPv6 respectively
Summing up, the outages we observe in RIPE Atlas for IPv4 appear to have been of a traffic blocking nature. The connections themselves stayed up. Low level pings got through, and as we’ve shown elsewhere, the large majority of prefixes remained visible in BGP. IPv6 connectivity, on the other hand, seems to have been completely lost for affected networks. Pings from disconnected probes show 100% packet loss and many routes disappeared from BGP for almost three days.
Latency Profiles Near Probes
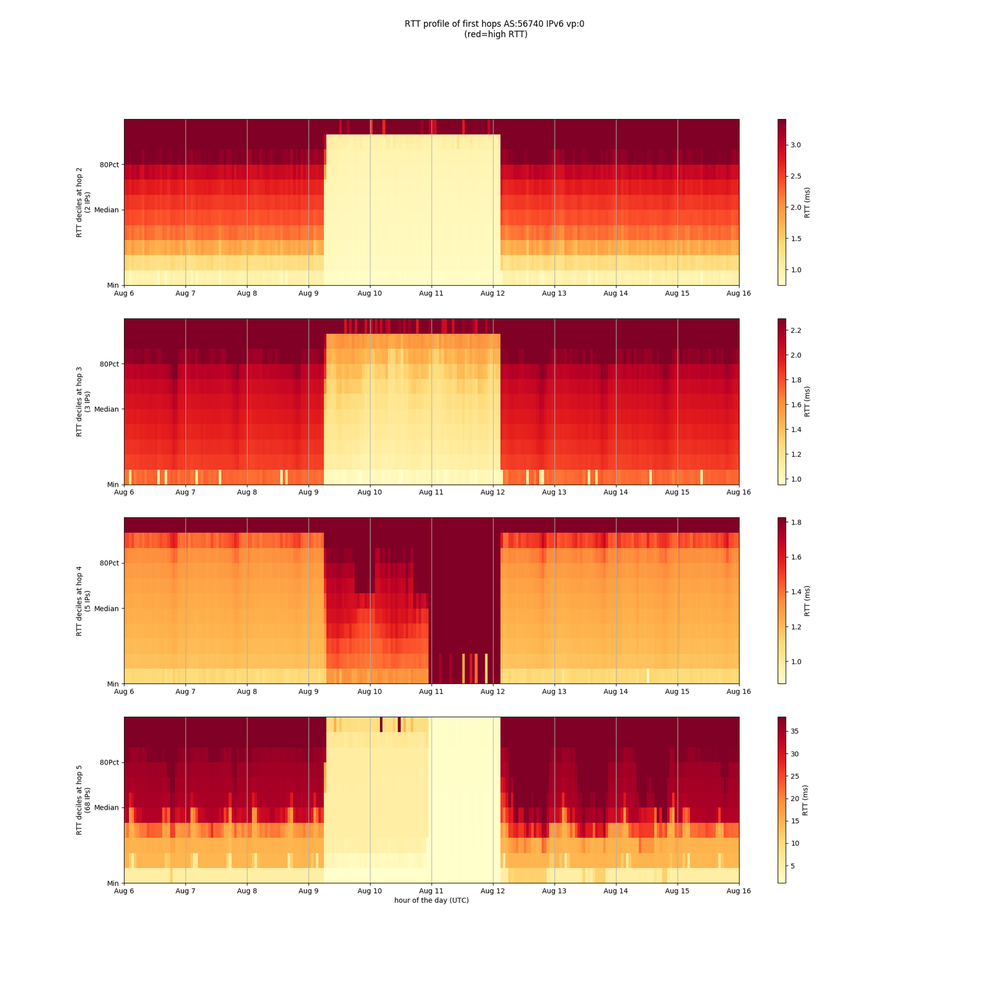
Thinking about what information we can retrieve from probes caught in outages and similar events, one thing we’ve been looking into is creating latency profiles of the networks we see near the affected probes. Each of the figures below show hops 2 to 5 of all traceroutes performed by a given probe. Dividing this up into hourly buckets, we calculate a latency profile for each hour (see note 1 below) that consists of 10 parts. Marking higher RTTs deep red and lower ones light yellow, we then visualise all this to see if and how latency patterns change over time. Taking into account certain caveats (note 2), these kinds of visualisations can be helpful in looking at the state of networks near RIPE Atlas probes.

Latency profiles for two probes in AS56740
Changes to the latency profiles from 9 to 12 August are clearly visible for both of the affected probes. There are a number of things that might have caused these anomalies. They could be due to path changes - i.e. if traffic at, say, hop 2 takes an alternative path for a while, this can result in a different latency profile. Or they could be due to changes in delay resulting from packet processing taking longer at specific routers. What is clear is that networks near the given probes were not in their normal state during the outage.
As we say, we'd like to develop these visualisations further so they provide more useful information about the state of networks near RIPE Atlas probes. Our hope, in doing so, is that this will eventually lead to better network troubleshooting tools.
Conclusion
Internet outages happen for all sorts of reasons - human error, malicious attacks, shutdowns, lockdowns, power cuts, weather events, natural disasters, and so on. Our goal is to contribute to the stable operation of the Internet by helping people analyse these events, better understand their impact, and so mitigate the effects of similar events in the future.
To this end, we offer a variety of tools and visualisations built around RIPE Atlas and our other services that you can start using to measure and monitor the state of the Internet right now. For instance, to start looking at RIPE Atlas measurement results in LatencyMON, as we did above, all you need to do is go to the RIPE Atlas measurements page, pick a measurement whose results you want to see, and click the LatencyMON tab.
We also keep looking for new ways to get more insights out of our data. The latency profiles above mark first steps in an effort to get more value out of traceroute data by analysing the first few hops around RIPE Atlas probes to get a clearer picture of what's going on in their neighbouring networks. While this kind of analysis would have been quite difficult in the past, we've recently been developing an environment where RIPE Atlas data can be made available as a dataset for cloud-based bulk analysis. Using the BigQuery functionality of the Google Cloud Platform for this, we are currently test-driving this platform ourselves before opening it up to our users. We hope that this will lead to the further development of this and other useful tools and visualisations. Stay tuned on RIPE Labs if you want to hear more about this!
As always, we rely on feedback from the community to get a better idea of how we can make the data we collect more useful and accessible to you. If you have any ideas, comments or suggestions, please leave them below or get in touch with us at atlas@ripe.net.
_______________________
Notes
1. We use APPROX_QUANTILES( result.rtt, 10) to create these latency profiles for hourly buckets of RTT data per probe, hop and IP address family.
2. Latencies that we see in traceroute intermediate hops can be due to routers getting more busy, i.e. packet buffers filling up, but can also be due to changes in the processing of these return packets. The latency profile we calculate for a given hop can contain the mix of multiple IPs and multiple devices/paths especially the further away from the probe one gets.


Comments 0
The comments section is closed for articles published more than a year ago. If you'd like to inform us of any issues, please contact us.