
We used a number of RIPE NCC tools and data sets to take a quick look at the recent DDoS attack on Dyn’s infrastructure. We wanted to see if this could be found in the data produced by the RIPE Atlas community.
DDoS attacks are on the rise. On 21 October 2016, an attack against DNS service provider Dyn caused issues for a list of well known services such as Twitter, GitHub, Reddit, Spotify, SoundCloud, Netflix, PlayStation, New York Times, Airbnb, and PayPal where people were unable to access their funds.


Figure 1: Various tweets from the day
The Attack From Dyn's Perspective
Dyn first assumed the cause was an issue with their DNS network. However, it soon became clear that it was a DDoS attack. At 11:10 UTC (7:10 ET), Dyn stated on their website: "We began monitoring and mitigating a DDoS attack against our Dyn Managed DNS infrastructure."
At that time, only the US East Coast was affected, but it eventually turned into a global problem, though users in Europe and Asia may have experienced fewer problems at the beginning of the attack.
In their incident report, Dyn noted that tens of millions of discrete IP addresses associated with the Mirai botnet were part of the attack. Mirai malware targets Internet of Things (IoT) devices like routers, digital video devices, IP cameras and others, transforming them into a botnet.
While Dyn announced at 13:20 UTC that their services had been restored, solving the issue took longer, with the attack continuing to affect their infrastructure into the afternoon. At 15:52 UTC, Dyn reported "we have begun monitoring and mitigating a DDoS attack against our Dyn Managed DNS infrastructure. Our Engineers are continuing to work on mitigating this issue."
Kyle York told reporters “We are actively in the third flank of this attack, it’s a very smart attack. As we mitigate, they react".
While the second wave of the DDoS attack was still going on, Ant Stanley used BGPlay to look at how Dyn tried mitigate the attack for a specific prefix that they used on one of their Name Servers (below).
Watch the BGP routes change as DynDNS deal with the DDoS attack earlier today ... https://t.co/PwIr3pCGY0 pic.twitter.com/ZL6gCQJu3W
— Ant Stanley 🎃 (@IamStan) October 21, 2016
What We Saw
It is hard to get a clear picture of the event, and we hope Dyn will publish a more comprehensive post-mortem in the future. Below are some examples of what was visible in our collected data.
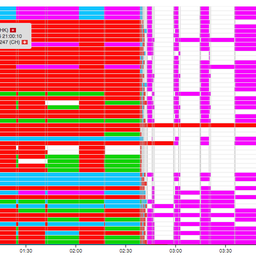
If we look at all the prefixes that Dyn's AS33517 announced around the time of the reported incidents (Figure 2), we see that most of them were stably announced on 21 October. Only a few went down briefly, for reasons unknown to us. So control plane connectivity was mostly unaffected.

Figure 2: Matrix showing all prefixes announced by AS33517 and how their visibility was affected
RIPEstat BGPlay
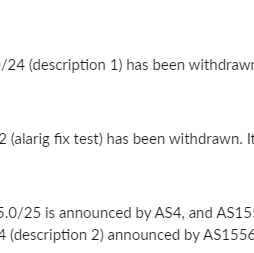
With BGPlay we can look at details for specific prefixes. For example, we see that 208.76.59.0/24 was one of the few prefixes that was briefly withdrawn (see Figure 3). This prefix contains some of the Dyn name servers.

Figure 3: 208.76.59.0/24 as shown in BGPlay
For this particular prefix, we can see that it was withdrawn at 15:58 UTC and, after a brief period of non-visibility, it was announced again at 17:00 UTC. This timing correlates with the second attack as reported by Dyn.
By day’s-end, the situation was slowly brought back to the state it had been in the morning. The same patterns repeated briefly again at the beginning of 22 October, between midnight and 04:00 UTC.
We took a quick look at other prefixes and also found patterns for them: some experienced short outages but the upstream mix was the same before and after the outage (see this example). For other prefixes, we hardly saw any changes in BGP paths that we monitor (see this example). A possible reason for this is that some of these prefixes are not involved with Dyn's DNS infrastructure.
RIPE Atlas and LatencyMON
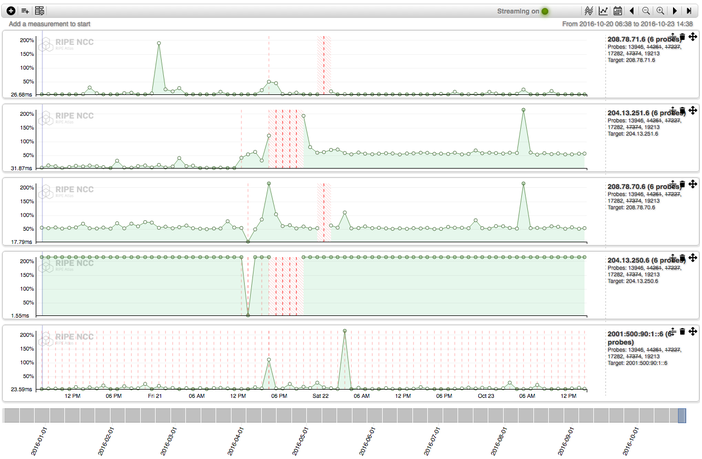
Figure 4 below shows our tool LatencyMON comparing different trends of latencies collected by multiple RIPE Atlas probes across the globe. It shows all the DNS data actively collected by RIPE Atlas measurements reaching a specific dynect.net name server.
Each line represents a different targeted name server. For the most part, measurements related to this event were scheduled by users after the first DDoS wave, so the first wave is only partially visible. We think these users scheduled active monitoring of their zones in DomainMON trying to understand what it was going on with their DNS and how they were affected.

Figure 4:The event monitored with LatencyMON
We can see that at around 12:00 UTC, RIPE Atlas probes started to experience unreachability for some of the name servers, and this got more severe at 16:00 when Dyn announced the second wave.
Conclusion
DDoS attacks this size are complex beasts, difficult to understand from the outside and hard to mitigate from the inside.
With our RIS service and RIPE Atlas project, we collect data useful for monitoring and troubleshooting infrastructures both at the BGP and IP level. The BGP data collected by our RIS vantage points, can be explored by using the BGPlay visualisation. It allows you to dig into effects seen for specific prefixes over time. In this case we show examples of various behaviours that can be seen for this particular DDoS attack.
DomainMON allows the user to monitor their DNS infrastructure, collecting and showing in real time latencies and unanswered queries of the involved name servers from thousands of vantage points around the world. The same approach is used in the DNSMON service, monitoring root and ccTLD zones, which in the past has proven to be useful in reducing the reaction time of DNS operators.
LatencyMON allows the user to have a real-time coincise view of latency trends collected from different measurements compared to one or more targets.
Using DomainMON, LatencyMON and other RIPE Atlas tools also increases the RIPE NCC’s measurement coverage. The reason we are able to provide a view of the Dyn outage is due to the measurements being done by the thousands of RIPE Atlas users who are using the network to perform measurements. The sum of this activity allows the entire RIPE Atlas community to benefit from a more complete picture of Internet events.
Comments 1
The comments section is closed for articles published more than a year ago. If you'd like to inform us of any issues, please contact us.
Eldad Chai •
Thanks for the great analysis. More info on the Mirai botnet as presented at the RIPE73 event can be found here: https://www.incapsula.com/blog/malware-analysis-mirai-ddos-botnet.html