This page contains a list of statistics the RIPE NCC provides on a regular basis, together with a short description and pointers to more information.
Table of Contents
1. RIPE NCC Membership Statistics
1.1.Total number of LIRs in the RIPE NCC service region
1.2.Number of LIRs sorted by country
1.3. Number of LIRs sorted by region
2.1.Remaining resources in the RIPE NCC IPv4 address pool
3.1. Number of IPv6 allocations and assignments
3.2. Number of LIRs with an without IPv6
3.3. Number of IPv6 allocations per country
3.5. IPv6 deployment at the network level
5.1. Operational RIPE Database statistics
5.2. RIPE Database inconsistency statistics
Introduction
Below you can find a compilation of statistics provided by the RIPE NCC. In addition to a graph, you will find a short description and a pointer to more information if applicable. Clicking on the image will bring you to the most up-to-date version of this particular graph.
This is a work in progress. We will add more statistics as they become available. We are also working on a statistics dashboard that will make it easier to search for certain graphs and representations.
If you have any comments or suggestions for additional statistics, please let us know, either by leaving a comment under the article or by sending a mail to labs at ripe dot net.
1. RIPE NCC Membership Statistics
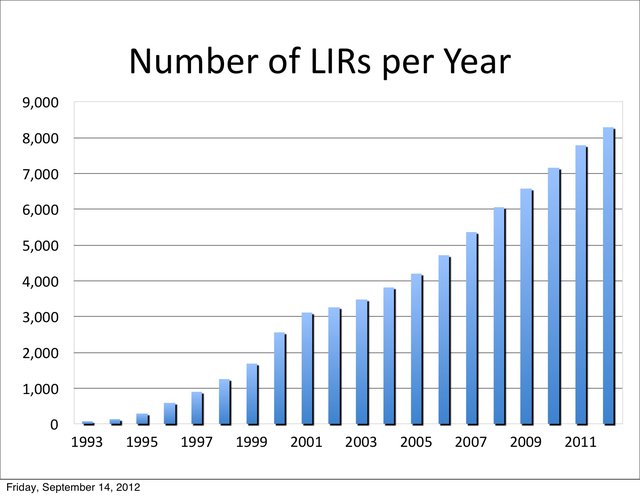
1.1. Total number of LIRs in the RIPE NCC service region
Description: The graph below shows the number of Local Internet Registries (LIRs) registered with the RIPE NCC per year. Note that the numbers for 2012 only show data until end of August 2012.
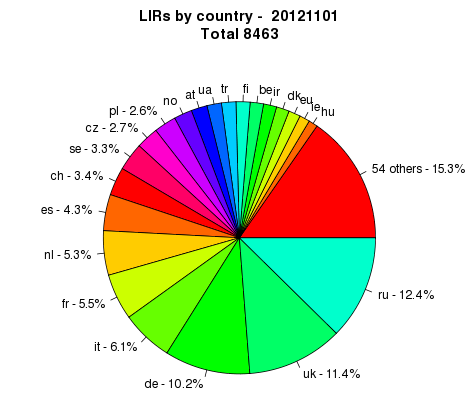
1.2. LIRs sorted by country
Description: The graph below shows the current number of Local Internet Registries (LIRs) per country.
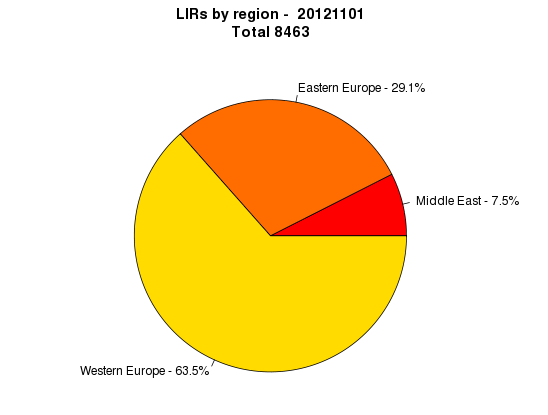
1.3. LIRs sorted by region
Description: The graph below shows the current number of Local Internet Registries (LIRs) by region.
2. IPv4-related Statistics
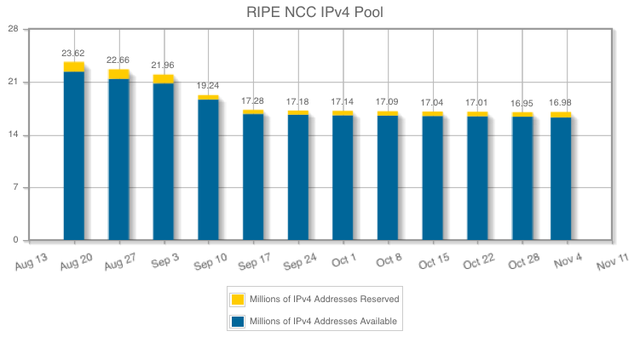
2.1. Remaining resources in the RIPE NCC IPv4 address pool
Description: This graph includes the last /8 that the RIPE NCC received from the IANA on 3 February 2011 and the /13 pool for temporary assignments (both shown by the yellow horizontal line).
More information: Clicking on the image will bring you to the most current graph and a more detailed description.
3. IPv6-related Statistics
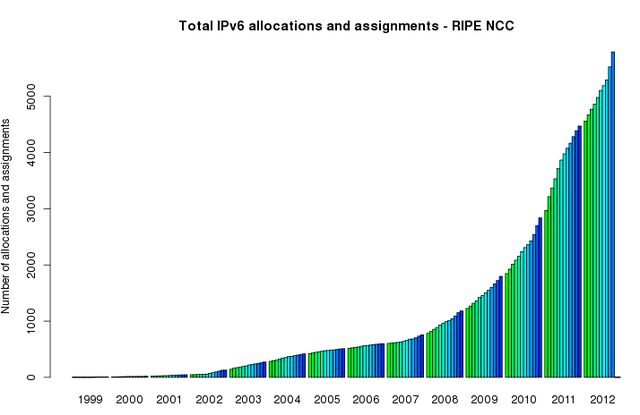
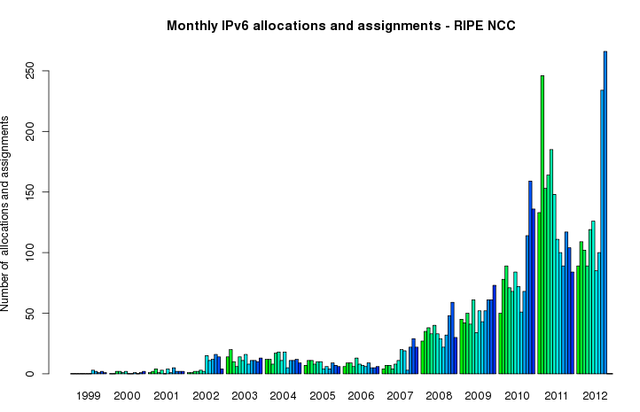
3.1. IPv6 Allocations (by month and total numbers)
Description: The two graphs show the number of IPv6 allocations and assignments made by the RIPE NCC to LIRs in its service region. The first one shows the accumulated number of allocations and assignments. The second shows the number of allocations and assignments made per month. Note that this doesn't show the actual number of addresses handed out. These graphs are updated monthly.
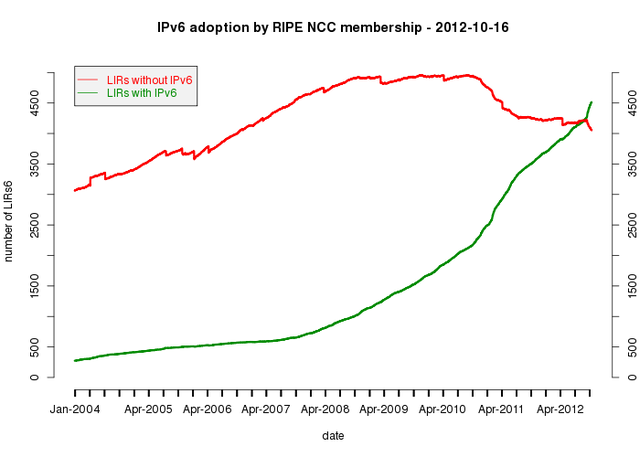
3.2. LIRs with IPv6 and without IPv6
Description: This graph shows the number of Local Internet Registries (LIRs) in the RIPE NCC service region that have an IPv6 allocation (green line) and those that don't have an IPv6 allocation (yet) (red line). The graph is updated daily.
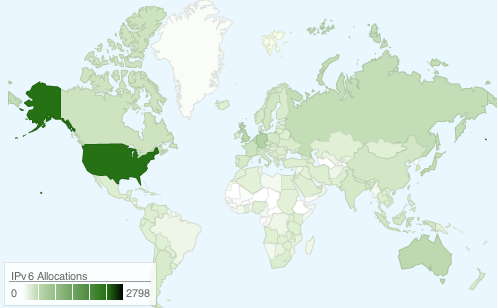
3.3. Number of IPv6 allocations per country
Description: On the map below you can see the number of IPv6 allocations made to organisations per country. The darker the green, the more allocations are made in that country. If you click on the image, you will get to the most up to date version of this map. When you move your mouse to a country, you will see the actual number of allocations made to organisations in that country. This map is updated daily.
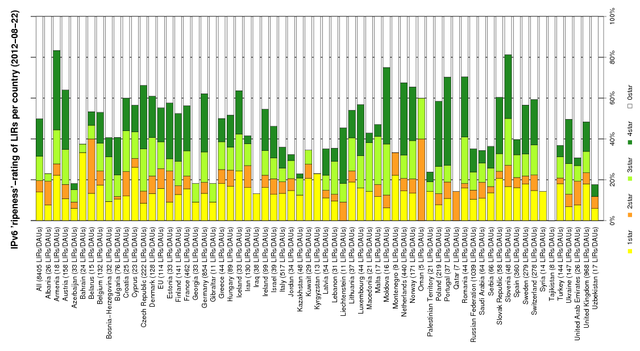
3.4. IPv6 RIPEness
Description: IPv6 RIPEness is a rating system that gives Local Internet Registries (LIRs) up to four "stars" depending on the IPv6 services they offer. This includes: IPv6 allocation, visibility in the Routing Information Service (RIS), route6 object in the RIPE Database and reverse DNS delegation setup.
More information: On the IPv6 RIPEness web page , you can find the methodology and a link to country-specific IPv6 RIPEness graphs. It also tells you how you can reach all IPv6 RIPEness stars (you need to be an LIR).
Much more information, earlier descriptions, graphs and results can be found on the RIPE Labs IPv6 RIPEness pages .
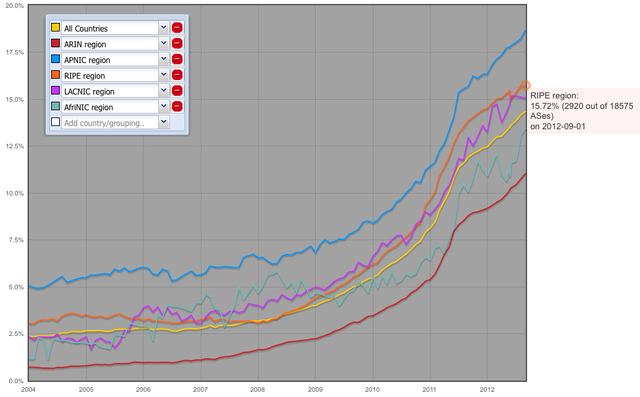
3.5. IPv6 deployment at the network level
Description: This graph shows the percentage of networks (ASes) that announce one or more IPv6 prefixes, sorted by countries or groups of countries. The graph is interactive and you can specify the countries you would like to see. When hovering over the graph, you can see the exact data for one specific point in time. We also provide you with a permalink on top of the page.
More information: In an article on RIPE Labs we describe the methodology and the results: Networks with IPv6 - One Year Later
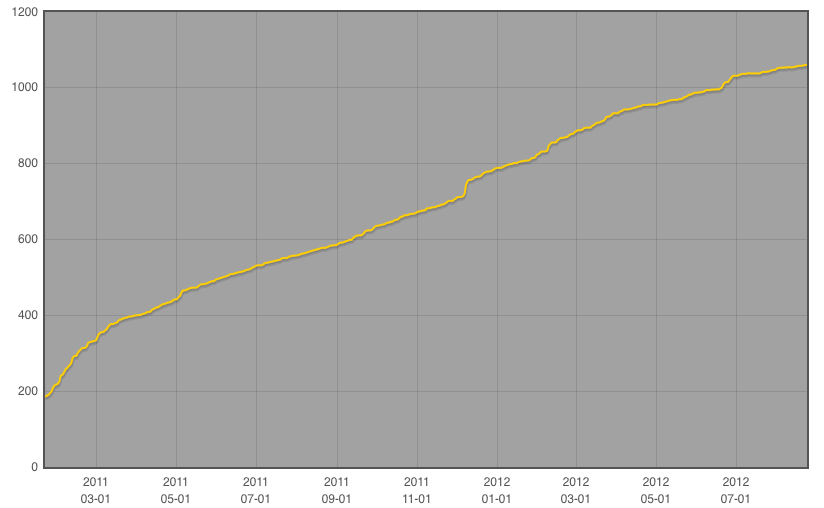
4. Certification Statistics
Description: The graph below shows the total number of resource certificates created under the RIPE NCC Trust Anchor.
More information: On the certification statics page you can choose to see other type of data, for instance, number of Route Origin Authorisations (ROAs) and IPv4 and IPv6 prefixes covered by ROAs. This information is available for all Regional Internet Registries.
5. RIPE Database Statistics
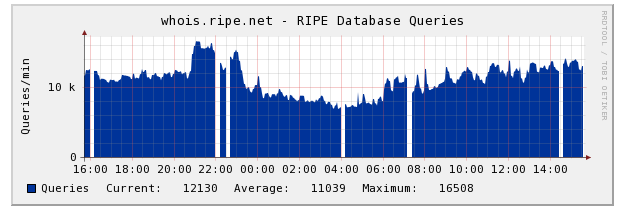
5.1. Operational RIPE Database statistics
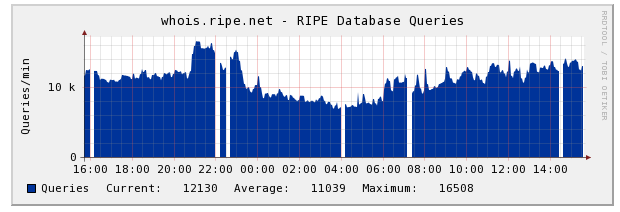
Description: We provide a number of operational statistics for the RIPE Database: Number of queries, updates, number of queued objects as well as response time of the database server.
5.2. RIPE Database inconsistency statistics
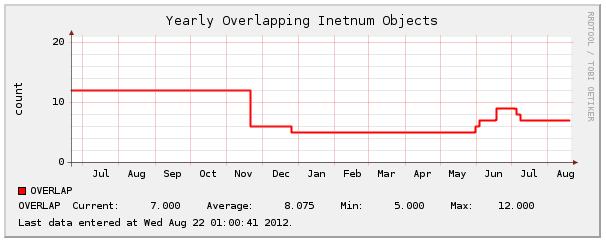
Description: The RIPE NCC provides reports and statistics for users to help correct inconsistencies in RIPE Database objects. The graph below shows for instance the number of overlapping inetnum objects.
More information: More information about this project and many more statistics can be found on the RIPE Database Consistency web page .
6. RIPE Atlas
6.1. RIPE Atlas statistics
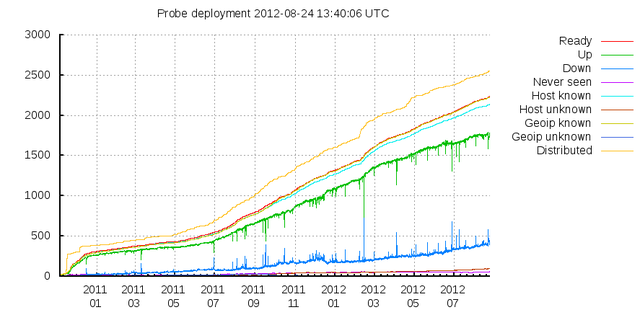
Description: We provide various statistics based on RIPE Atlas showing the number of probes, active users and more. The graph below shows the overall probe deployment.
More information: The RIPE Atlas project is introduced here . You can also find a wealth of information and interesting results on the RIPE Atlas pages on RIPE Labs .
6.2. RIPE Atlas maps
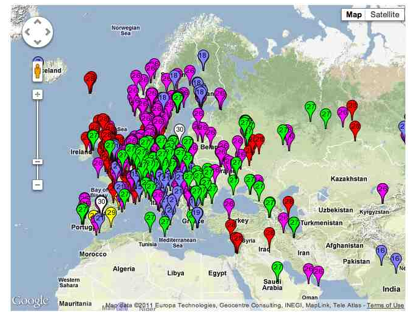
Description: We also provide a variety of maps that visualise interesting measurements based on RIPE Atlas data. The map below shows, for each Atlas probe, which root DNS server instance the probe ends up querying when they ask a particular root server.
7. RIPEstat
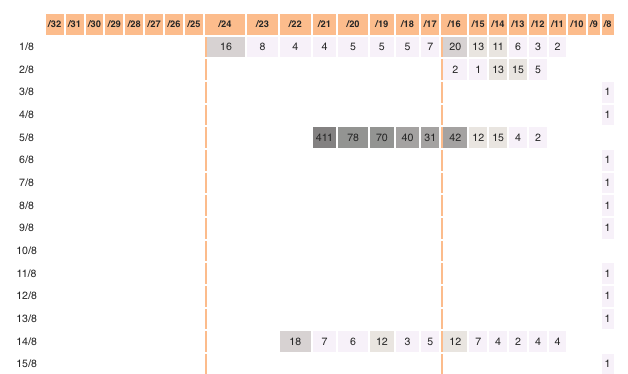
Description: Apart from providing information and statistics on specific address resources (IP address prefixes and ASes), RIPEstat also provides some aggregate statistics like the one below. This particular image provides an overview of the total number of IPv4 delegations grouped by /8s. Note that this is a screenshot and only shows part of the information. By clicking on the image you will see the complicate information.
8. K-root Server Statistics
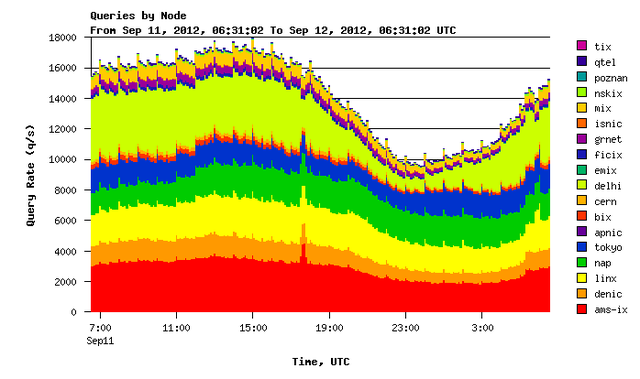
Description: The RIPE NCC operates k.root-servers.net , one of the 13 Internet root name servers . The K-root service is provided by a set of distributed nodes using IPv4 and IPv6 anycast . The image below shows the number of queries per second seen at all K-root nodes (global and local nodes combined).
More information: You can find more information about operating K-root including the location of all K-root nodes and other statistics on the K-root web page .



Comments 7
The comments section is closed for articles published more than a year ago. If you'd like to inform us of any issues, please contact us.
Tolli •
Isn't there statistics available on your own DNS infrastructure (reverse DNS)?
Mirjam Kühne •
Hello Tolli, We currently don't publish statistics on reverse DNS, but might do so in the future. However, we allow zone transfers and publish all zones[1] we are authoritative for. We also publish daily dumps of the RIPE DB[2]. You could use this information to derive your own statistics in the meantime. [1]ftp://ftp.ripe.net/ripe/reverse/zones/1.0/ [2]ftp://ftp.ripe.net/ripe/dbase/ripe.db.gz
Daniel Karrenberg •
Is there anything besides the things Mirjam mentions that you think we should provide?
Anonymous •
How about statistics on teh number of LIRs? and maybe which countries they are located in?
Mirjam Kühne •
Hi, under section 1. you can see the number of LIRs (it said number of members before, but to be more accurate, I changed that to number of LIRs now). We are working on graphs showing number of LIRs per sub-region, size etc.
Yi •
Where can I find the IPv4 space amount that RIPE hold ?
Mirjam Kühne •
Yi, If you go to this page https://labs.ripe.net/statistics/?tags=ipv4 and scroll all the way to the bottom, you will see the number of remaining IPv4 addresses. If you click on the title of the graph, you wil see another pge with more information about the RIPE NCC's available IPv4 address pool. Please let us know if you have any more questions.