Exploring RIPE Atlas Traceroutes from 2012 to 2019
• 29 min read
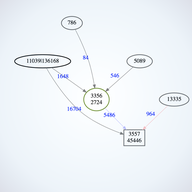
This analysis of RIPE Atlas traceroutes for days in 2012, 2015, 2017 and 2019 displays full network graphs for each successive half-hour and develops an algorithm for finding node or edge outages of an hour or more.
