
It has been almost 3 years since we promoted RIS Live to a full production service. Its biggest advantage is that it delivers RIS data in real time, with minimal delays from the RIS collectors to our users. We had received a lot of positive feedback about the service, however, we were still wondering – how big actually is the “minimal” delay?
Where do we start? If you go to the RIS Live web page, you could observe the delay immediately in the simple client that is shown there – and the value I’ve seen there was always in the order of seconds. This is pretty good, but does it always stay like this? Does it change when filters are applied? Does it vary per collector? We need to measure this properly.
So we have written a RIS Live client that connects to the system, receives messages, evaluates their delay (as a difference between the time our client received it, and the timestamp embedded in a message, indicating the time it has been received by the collector), and stores it for later evaluation.
That wasn’t a difficult task – after all, RIS Live is praised for its simplicity of use. But the first results were “interesting”. As expected, the delay was mostly in the order of seconds, but after some time it would start raising gradually to the order of minutes or even tens of minutes! This could be an indication that the backend of RIS Live becomes “slow” after some time, or under certain conditions. However, when we were restarting our measuring client, the measured delays would almost always drop back to the order of seconds. We’ve also seen an opposite behaviour – our client would observe “normal” low delays, but after restart would immediately report long delays – in the order of tens of minutes. We realised that the reason for such behaviour lies in the fact that RIS Live has several backend servers with a load balancer in front of them, so when the client reconnects, it will very often start using data supplied by a different backend server. And it looked like those servers had their “bad moments” at different times.
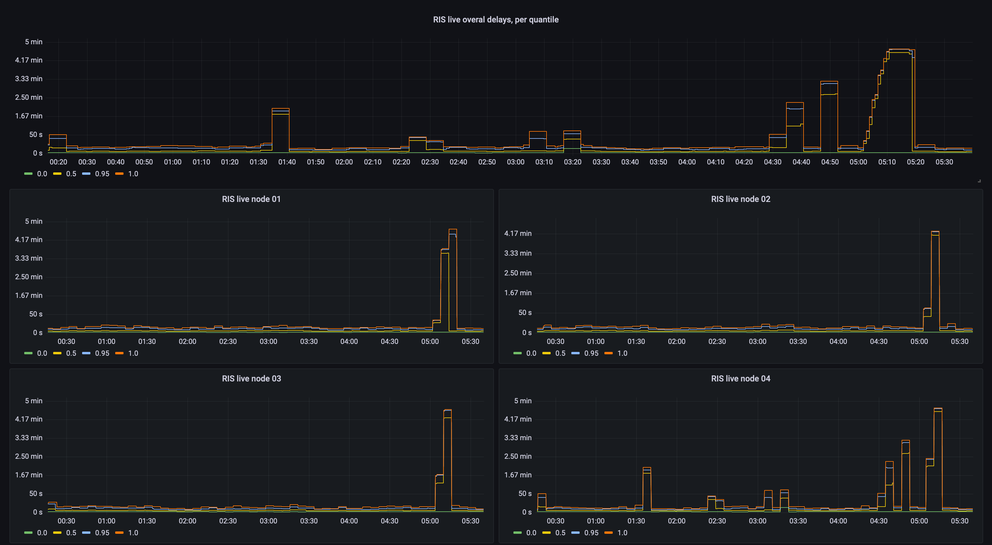
Our next step was to measure delays on all backend servers separately. This revealed another interesting pattern: mostly there was no correlation between delays on different servers, but sometimes there was, specifically, if we look at the outliers, or maximum delays – they were identical on all backend servers, and present at the same time (like the spike on the charts below between 5:00 and 5:30).

More scrupulous inspection of delays data revealed that in the cases when the delays increased on all backend servers, the delayed messages were coming from the same route collector. This is logical, because most collectors are remote, connected through the “normal” Internet, and if a collector loses connectivity to our datacenter in Amsterdam, it queues data locally until connectivity restores. Upon arrival, those queued messages would have higher delays. The practical outcome of this observation though was that we also need to monitor delays per route collector (RRC).
As a result of this, we have built a dashboard that allows us to monitor delays of RIS Live messages on all backend servers and per route collector, so that we could see whether the build-up in delays is caused by the backed server itself, or by poor connectivity to the RRC.

As you can see on these charts, the delays of messages coming from node ris-live05 started to build up at 12:00, initially only for some RRCs, but between 18:00-21:00 affected all of them.
But what is causing this specific backend server to induce delays, while other servers are doing fine? Remember, all these servers are behind a load balancer, and even though it should distribute load evenly, it does so only for new client connections. Once connected, the client remains on the same server, until it disconnects or connection breaks. So the sets of clients are different on different backend servers, and we have identified two problems that affect the ability of a server to deliver messages without delay.
The first one is clients that could not cope with the stream of data. The server has to wait until the client acknowledges the data that has been sent to it, and if the client is not able to do that in real-time, the server has to buffer more and more messages for that client, which eventually affects its ability to serve other clients as well. This problem is difficult to solve, we can only fight the symptoms. The options available are either to disconnect slow clients (and we do that, eventually), or increase the capacity of servers.
The second problem is filtering requested by the clients. Some of the filters are quite complex, and we noticed that the filtering engine uses a lot of CPU power, and eventually slows down the system. We have identified inefficiencies in the filtering mechanism, and this is what we could improve without expanding capacity of the servers, by improving the architecture of the system.
The backend servers were receiving data gathered by our collectors, which is in JSON format. They had to parse that data, understand the type of BGP message, apply filters, and compose another JSON message – in the format of RIS Live. This was done by each of the servers, and is inefficient. We use Kafka to deliver messages from collectors to all components of RIS, including RIS Live. So instead of delivering “raw” messages from collectors to RIS Live, we have built a pipeline that converts those “raw” messages into JSON format of RIS Live, but also extracts all the data needed for RIS Live filtering into separate fields. And we package all that into a more efficient (than JSON) binary format (Avro) and send that to the dedicated Kafka topic. So what’s left for our RIS Live backend servers to do is to pick up those messages, apply filters on already extracted fields, and send already pre-cooked JSON messages to clients.
The improvement in delays was quite visible right after the deployment:

With this change we have made another important improvement. Because Kafka uses “at least once” delivery guarantee, it was possible that the stream of messages from collectors contains duplicate messages. We deal with that by tracking message times and serial numbers, and eliminating repeated messages. However, this was not implemented in RIS Live before. Now the pipeline that generates new messages relies on the duplicate filtering we already had, and uses “exactly once” delivery guarantee for the RIS Live topic, so you should not be getting duplicates anymore.
We are still closely monitoring RIS Live after this change and making adjustments, but we could already see that stability of low delays improved significantly:

The delays mostly stay below 1 minute. The higher values that you could see on this chart are for RRC23, which lost it’s connectivity for some time. This chart is now also available publicly on our website.
We would like to hear if you also noticed these improvements, or have any comments. You could share your thoughts in the comments here, on the RIPE Forum, or on the ris-users@ripe.net mailing list.

Comments 0
The comments section is closed for articles published more than a year ago. If you'd like to inform us of any issues, please contact us.