
For a while now, the number of active RIPE Atlas probes has hovered around the 9,400 mark. This means that new probes are being connected at a fast enough rate to replace failing probes, but not enough to grow the network. At the same time, the version 3 probes have problems with their USB sticks. This led us to wonder whether these two issues are related.
Unfortunately, when RIPE Atlas log records are archived, the goal is just to preserve them, not to keep the data easily accessible. So recently, I took some time to process the probe connect logs. These logs detail when each probe connects to a controller and when the connection is lost. A plot of this data is shown in Figure 1.

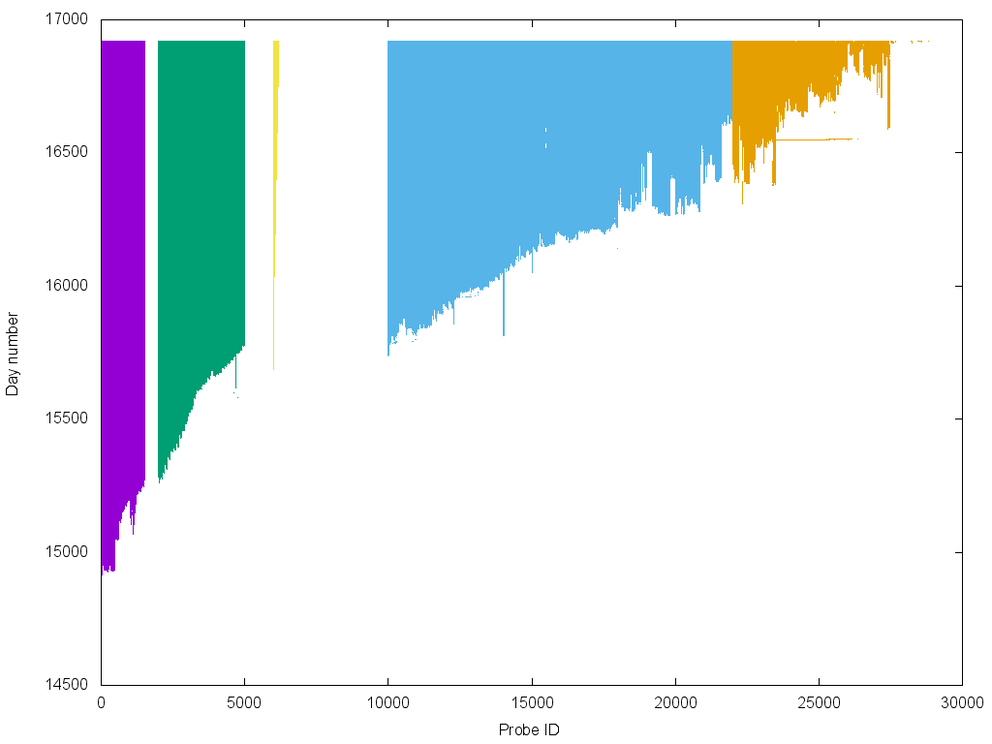
Figure 1: Overview of probe connect times
The horizontal axis shows the probe ID (which is related to the probe version), and the vertical axis shows the day number (the Unix time stamp divided by the number of seconds in a day. For a qualitative analysis, exact dates are not important.
The five different colours represent the different versions of probes. The purple colour on the left are version 1; green are version 2; yellow are RIPE Atlas anchors. Starting at 10,000 are the version 3 probes; they are represented by two different colours based on a rough estimate of which probes were initially shipped with a SanDisk USB stick (blue) or a Verbatim one (brown).
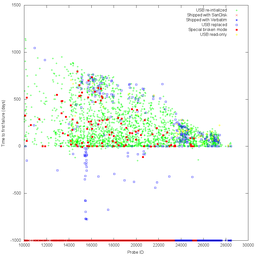
What is very clear is the time when the probes first connected. A this level of detail, this roughly corresponds to when the probe was shipped to the host; to get more detail, we have to zoom in. Figure 2 shows the same data, but in a 30,000 by 2,000 image.

What we see is that the version 1 probes (purple) are quite stable. Lots of vertical bars show that probes keep on running. Version 2 probes (green) are also quite stable, but not as much as the version 1 probes. It is obvious that anchors (in yellow), which are individually managed, are very stable.
Based on the large number of stories we hear about the USB sticks causing problems in the version 3 probes (blue and brown), we expected to see these probes failing over time. This is especially expected for the first of these probes, meaning at the top of the plot, the colour should be less dense than at the bottom. However, the version 3 probes, have vertical bars similar to the version 1 and 2 probes.
Instead, the dominant pattern seems to be that the version 3 probes never manage to connect in the first place, resulting in vertical white space. We can also clearly see that there is hardly any difference between version 3 probes shipped with SanDisk USB sticks and those that were shipped with Verbatim.
So, the conclusion we can draw from a qualitative analysis of the data is that the probes not connecting at all is a much larger problem than probes failing over time due to hardware issues. This is something that we'll continue to investigate in order to try to improve the situation. Please check back for any future updates.

Comments 0
The comments section is closed for articles published more than a year ago. If you'd like to inform us of any issues, please contact us.