

The Internet Health Report (IHR) is an open source project, partly funded by RIPE NCC Community Projects Fund, that monitors AS connectivity. This article is a quick introduction to IHR and shares some good examples of IHR monitoring capabilities. Interested? Take a look at our website (https://ihr.iijlab.net) for more results and send us your feedback.
Overview
Every network connected to the Internet relies on other networks to reach online users and services. Hence the connectivity and reachability of a network depends on the numerous networks that help it to reach the rest of the Internet. Monitoring external networks is crucial to understand intermediate connectivity issues and improve resiliency. Measurement platforms, such as RIPE Atlas and RIS, can help in these regards, but the volume and velocity of these datasets is quite daunting for non-technical stakeholders.
The Internet Health Report (IHR) aims to fill this gap by providing an analytics platform for Internet infrastructure data. At its core, IHR ingests mainly BGP and traceroute data and computes network metrics such as network dependencies and latencies. These are then presented in the form of interactive reports on the IHR website. There are currently two types of reports, the global report contains recent anomalies identified across all networks, and network reports display all computed metrics for a certain AS or IXP.
Network Dependency
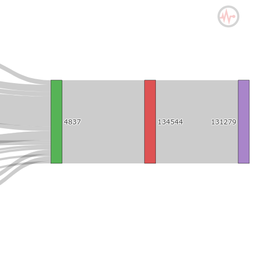
The first metric shown on IHR reports is network dependency (also known as AS Hegemony). It measures the dependency of an AS to other ASes and is based on BGP data. The values range between 0 and 1, and represent the fraction of paths that contains a certain ASN.

Figure 1: Network dependency of the RIPE Meeting’s AS during RIPE 78 in Iceland. View the interactive plot here.
For example, Figure 1 shows the network dependencies for RIPE Meeting’s AS (AS2121) during RIPE 78 in Reykjavík, Iceland. The top plot shows the dependencies over time and the bottom table shows values for a certain point in time. Here Farice (AS56704, RIPE 78’s host) has the score 1.0, the highest score possible, meaning that BGP paths to AS2121 usually contain Farice's ASN. The other dependencies are much lower and represent Farice's upstream networks (Tata, GTT, and Cogent). The change around 12:00 on 21 May shows that numerous paths were briefly rerouted through Cogent, which can be confirmed with BGPlay by clicking on the ‘AS Graph’ table header (not shown in Figure1).
IHR also reports the number of ASes that depend on a network. In Figure 1, this graph is empty, meaning that AS2121 provides no transit. For a transit network the number of dependent networks represents its active customers. For example Farice’s report page shows that AS2121 was dependent on Farice in May 2019.
This dependency metric enabled us to monitor a lot of different routing events, including:
- Rerouting caused by DDoS attacks: https://www.zdnet.com/article/carpet-bombing-ddos-attack-takes-down-south-african-isp-for-an-entire-day/, https://ihr.iijlab.net/ihr/en-us/networks/AS36459?af=4&last=3&date=2018-03-02
- BGP route leaks: https://ihr.iijlab.net/ihr/en-us/networks/AS396531?af=4&last=3&date=2019-06-25
- Topological changes in disputed areas: https://www.iij-ii.co.jp/en/members/romain/pdf/romain_gi2020.pdf
Latency
IHR also monitors network latencies using traceroutes collected by the RIPE Atlas measurement platform. We have two types of latencies: average latencies between hosts of two networks (network delay) and the link latencies of a single network (link delay).
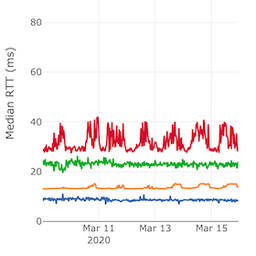
Figure 2 shows an example of network delays from SFR (AS15557) to other networks in Europe during the national lockdown in France which began on 17 March. The increased latency to common resources, such as Google and DNS root servers, reveals congestion that took place concurrently with the stay-at-home measures. Clicking on the graph displays the bottom table, that shows the number of Atlas probes and samples used to compute these values. It is important to check that these values are stable during delay changes and thus the observed delay increase is not due to measurement bias.

Figure 2: Network delays for SFR (AS15557) during the start of the national lockdown in France. View the interactive plot here.
As we observed several congested eyeball networks worldwide during COVID-19 outbreak, we also designed an experimental dashboard to monitor the impact of lockdowns in different countries during a recent RIPE NCC hackathon . For more details, read the corresponding RIPE Labs article.
Figure 3 shows an example of link delays for Telia (AS1299) during the update release of the game Call of Duty. The spike on 10 March around 20:00 UTC represents the overall delay increases that occurred for Telia’s IPs found in the traceroute. The table shows the exact IP addresses that were impacted the most.

Figure 3: Link delays for Telia (AS1299) during the release of a large game update. Interactive plot available here.
Disconnection
Finally, IHR monitors the connectivity of RIPE Atlas probes to detect geographical areas or networks that disconnect from the Internet. This is by no means a comprehensive Internet outage detector but it allows us to monitor disruptions in areas and networks that host RIPE Atlas probes.
Figure 4 depicts IHR results for a Virgin Media outage that took place in April 2020, during the COVID-19 pandemic lockdown. The top map shows the location of probes that disconnected during the outage, and the diameter of each circle represents the duration of the disconnections. One advantage of using RIPE Atlas probes for monitoring outages is to view the outage from the inside. The three bottom plots show ping results from disconnected probes towards RIPE NCC servers, the K-root server, and Google DNS, where vertical red dashed lines represent unsuccessful pings. This representation helps us to better understand the impact of the outage. In this case we can clearly observe the short hourly disconnections that were reported in the news.

Figure 4: Virgin Media outage on April 27th. Interactive plot available here
Explore more
This article is shows just a few examples of the views offered by the Internet Health Report website (https://ihr.iijlab.net). Feel free to browse https://ihr.iijlab.net for more results and let us know what you think. If you want your AS to be fully covered by IHR you should consider deploying Atlas probes.
Displayed data is also available through our API and python library so you can easily integrate these results to your tools.
Feedback
IHR is an on-going research project, we are planning new improvements that need both open source and financial support, let us know if you would like to be a part of this. Just as important, your feedback in the comment section below or by email is invaluable to us. It will really help us to determine where we should prioritise our efforts to meet community needs.

Comments 0
The comments section is closed for articles published more than a year ago. If you'd like to inform us of any issues, please contact us.