
Since we launched Khipu, we’ve been working to pin down the most useful, real-world workflows. This article walks through six core use cases - from outage detection, through routing policy validation, to exploring IXPs along network paths.
Since we introduced Khipu in August, we've been exploring ways to make our new visualisation tool as useful as possible. Many of the updates we've been making help to better serve the use cases we had in mind when we were creating Khipu, but we're also very glad to have heard back from members of the community about some excellent use cases they've discovered for themselves.
In this article, to demonstrate just what Khipu can do for you, we share six use cases that are at the top of our list right now. Some showcase changes we introduced since launch, while others are included purely to show what can be gained by looking at RIPE Atlas measurements this way.
So what does Khipu do again?
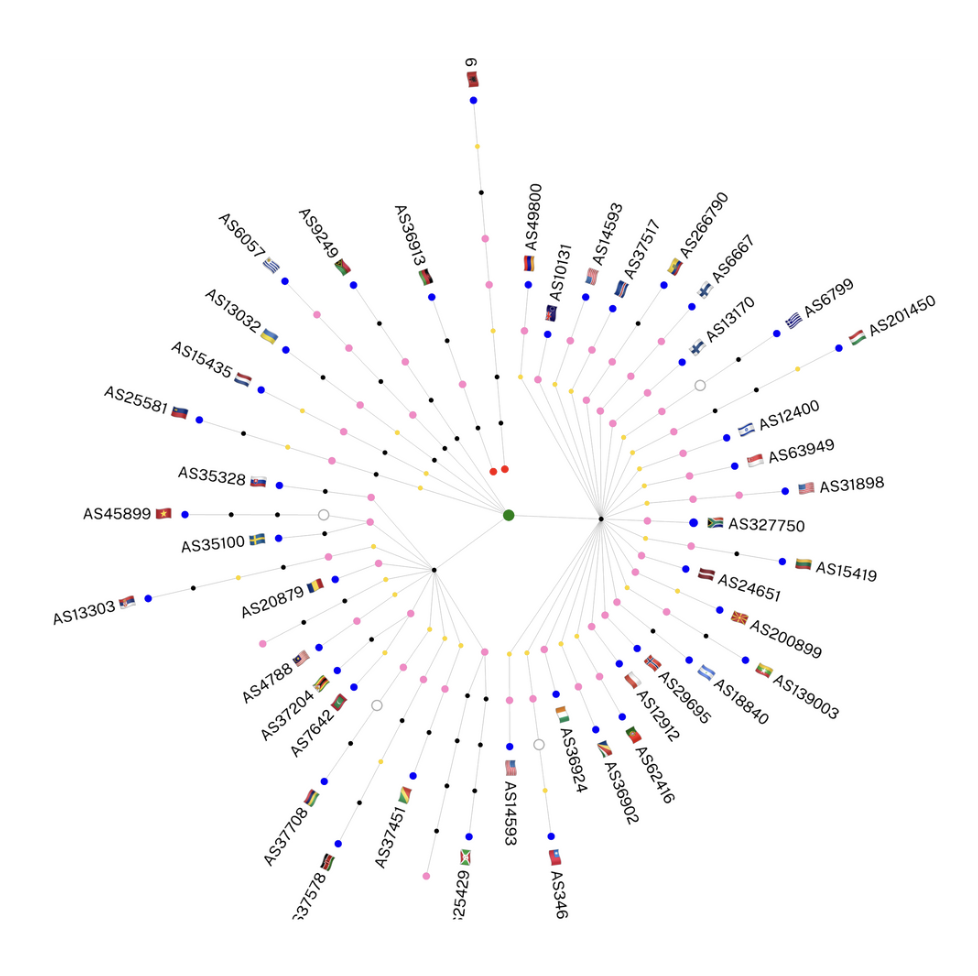
In short, Khipu lets you quickly render the results of RIPE Atlas traceroute measurements into highly informative hop-by-hop views of network paths, whether by IP, AS, or country. In the illustration below, for instance, we see paths across networks from the blue source nodes to the green target node:

Khipu can also render single view DNS or ping measurements. Much more detail can be found in the docs or our previous article introducing Khipu on RIPE Labs.
Toolbar
We've made a number of changes to Khipu since its launch, and perhaps the first place you're going to notice this is in our updated toolbar. Here's a quick visual overview of what you can do there:

And here are some tips on how to adjust the toolbar to get the most out of Khipu:
- Toggle
Successfuloff during incidents to remove noise (only view failures). - Distance Mode =
RTTto surface the worst paths first. - Enable/disable specific countries in the
country filter - Drag
RTT Range Filterto exclude healthy traces quickly. - Depending on type, use
Path Filterfor ASN, hop/target IP, IXP name (or just "ixp"), ProbeID, RCODE, NSID, and DNS Answers. - Open
Colour Legend(if collapsed) for fast orientation. Countprovides immediate feedback on the number of paths in your current view.
Use cases
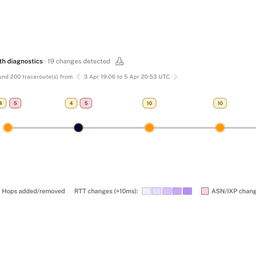
#1: Detect outages and narrow blast radius
You encounter intermittent failures: pages hang, requests time out. You want to localise where the issue lies: your local network, the destination service and its immediate network, or the transit path in between. In other words: is it you, them, or something in the middle?
How Khipu helps: Khipu highlights all unresponsive hops (yellow) and the last successful hop (red), so you can see at a glance exactly where the packets stop. See it in Khipu.

Workflow (step-by-step):
- Load traceroute measurement; View Mode:
IP; toggleSuccessfuloff - Identify the first failing hop (red/yellow segments and hop popup details)
- Switch to
ASNto attribute the failing segment - For domains: analyse DNS measurement with
Path Filteron IP/RCODE/answer data
Outcome: Faster triage and precise escalation with clear evidence of where packets stop and who owns the failing segment.
#2: Troubleshoot latency spikes or packet loss
Users report slow or flaky access to an API/SaaS/CDN, so you point Khipu at the target to see the path hop-by-hop.
How Khipu helps: The IP view in RTT mode quickly highlights the first hop where latency or loss spikes, surfacing the “worst first”. The RTT view also shows orange dot anomalies (like rtt hops that take longer than the end to end RTT and are therefore unlikely). Switching to the ASN view and probe cohorts attributes the bad segment to a specific provider and shows which regions/ISPs are affected, turning vague slowness into a precise, actionable fault. See it in Khipu.

Workflow (step-by-step):
- Load the affected
TRACEROUTEmeasurement. - View Mode:
IP; Distance Mode: set toRTTto emphasize latency stretches. RTT Range Filter: drag the right handle to focus on slow traces only.- Toggle
Successfuloff to isolate failures (optional). Path Filter: search suspect hop/interface IPs- Switch to
ASN viewfor provider attribution - Cross-reference with ping measurement results
Outcome: Clear evidence of where latency or loss begins, plus the responsible ASN.
#3: Validate routing paths and policy changes
You need to confirm a partner accepts your prefixes and prefers them (policy/route‑map checks) and verify transit choices.
How Khipu helps: ASN view reveals who carries the traffic; Path Filter lets you search by partner ASN or specific interconnect interfaces. IP view confirms any hop‑level anomalies. See it in Khipu.

Workflow:
- View Mode:
ASN; toggleASN Labelson. Path Filter: search partner ASN or interconnect interface IPs or IXP name.- Compare results before/after policy changes.
- Switch to
IP viewto spot micro-loops, rate limiting, or MTU symptoms.
Outcome: Visual confirmation that your routing policies are working in practice - traffic flows via intended partners/transit providers with proper path selection.
#4: Verify DNS Resolution Patterns
DNS misconfigurations can be subtle and hard to spot when checking from a single location, but they can cause major problems for users in specific regions or networks.
Why Khipu: DNS misconfigurations - whether outdated CNAMEs, incorrect IPs, or regional resolution anomalies - can break service for users in specific locations. Khipu visualises all probe responses at once and lets you search for specific values to quickly verify your DNS configuration is working as expected globally. See it in Khipu.

Workflow:
- Load a DNS measurement in Khipu to see all probe responses
- Use the path filter to find specific expected values (e.g., IP address, ASN, NSID, answer content)
- Review which probes returned the expected responses vs. unexpected or error responses
- Optionally correlate with traceroute measurements to verify routing to resolved IPs
- Use geographic or ASN grouping to identify resolution patterns by region or network
Outcome: Clear confirmation that DNS is resolving as expected across your target regions/networks, or quick identification of misconfigurations, stale records, or geographic resolution anomalies.
#5: Identify and reduce concentration points
One way to help keep networks resilient against targeted attacks and other incidents is to avoid excessive traffic concentration. You want to take a look and distribute traffic better.
Why Khipu: Hubs stand out visually; filtering by hop/interface IP or ASN isolates all paths through a concentration point; Probes show which sources feed it. See it in Khipu.

Workflow:
- View Mode:
IPto see shared‑hop geometry; switch toASNto tie ownership. - Optional: toggle
Probes(IP view) to show Probe IDs instead of source IP labels. - Path Filter: enter the interface IP of interest to isolate all paths through it.
- Compare
Countbefore/after filtering to measure concentration.
Outcome: Actionable targets for distribution (policy changes, new peers, or capacity moves).
#6: Explore IXP connectivity along network paths
Internet Exchange Points (IXPs) play a crucial role in efficient Internet routing, but their presence in traceroutes isn't always immediately obvious. Network engineers often need to explain to colleagues and management why IXPs are valuable, and to analyse how traffic flows through peering relationships at exchange points.
Why Khipu: Khipu's IXP detection and visualisation features make it easy to identify which hops in a traceroute path are connected to IXPs, reveal complex peering patterns, and demonstrate the value of IXP connectivity. See it in Khipu.

Workflow:
- Run traceroute measurements to a destination where you suspect IXP peering
- In Khipu, observe the coloured nodes and look for IXP attributions in hop details
- Type 'ixp' in the Path filter to show only hops associated with IXPs (or type the name of a specific ixp to see only that)
- Compare views with and without IXP filtering to demonstrate their role in the path (use the include/exclude button in the path filter)
- Examine cases where the same IXP appears multiple times in a path (indicating multi-provider exchanges)
Outcome: It lets operators quickly see how IXPs shape their traffic - who they peer with and any anomalies - so they can clearly demonstrate IXP value.
Summing up
We hope you found the above examples illustrative of how Khipu can render RIPE Atlas measurement results into meaningful visualisations. As we keep working to improve the tool, we're keen to get your feedback, and to hear more about the interesting, inventive use cases you're coming up with as you explore the tool. So please leave your comments below, or write back to us directly at atlas@ripe.net.
Comments 0