This is the third in a series of articles about the structure of the ISP industry within the RIPE NCC service region. This time we compare the distribution of RIPE NCC IPv4 addresses to the distribution of reserve assets across banks and financial institutions that report to the European Central Bank.
Introduction
In the first article in this series, IPv4 Concentration|Diffusion 2.0.1 , we examined the number of IPv4 addresses distributed by the RIPE NCC to members between the 1990s and 2010. We concluded that our industry is amazingly open and varied. In the last RIPE Labs article on this subject How Does the Internet Industry Compare? , we looked at ways to compare our industry with other industrial sectors, and identified a number of characteristics that an industry must have in order to be comparable to the Internet industry. Our initial study focused on the two most basic criteria: accessibility of industry-level resource distribution data, and the ability of industry members to directly participate in a global market. We selected the global auto manufacturing sector as our first reference industry for comparison to the Internet.
While we believe that the results of that initial comparison were genuinely informative, we identified three significant inconsistencies. First, data limitations obliged us to compare worldwide production shares in the automobile industry to the region-specific data that RIPE NCC maintains. Second, we noted that the auto industry data only covers the "final producers" of complete automobiles, whereas RIPE NCC data shows all regional IPv4 address recipients, including many "intermediate producers" of Internet services that are not visible to most consumers. Finally, the cumulative distribution of IPv4 has been shaped in part by conservation-related concerns that (at least to date) have no parallel in the free-wheeling commodity markets that dictate the prices of rubber, steel, and other critical inputs for auto manufacturing.
In this article we use the same basic criteria as before, but this time applying them to an industry that does not have any of the inconsistencies described above.
Comparison: Monetary Liquidity vs. Digital Liquidity Providers
As mentioned above, there are a number of characteristics that make the financial industry a good candidate to compare it with the Internet industry:
1. Like the RIPE NCC, the European Central Bank ( ECB) provides a lot of detailed information about their industry members (individual firm-level statistics, as well as national-level and other aggregate measures where disclosure of individual company-level data is not possible).
2. Both industry groups are composed of institutions that are based in Europe, but which may have business operations around the world.
3. Both industry groups are composed of many thousands of autonomous but highly interdependent companies operating in every segment of the associated industry, from well-known end-user oriented "retail" producers to providers of enterprise-oriented services, retail product inputs, and other specialized services.
4. Both industries depend on, and directly participate in a shared distributed liquidity (or exchange-enabling ) technology that employs some form of distributed token system to reduce the cost and complications of exchanging things of value. Within the Eurozone, the most standard (or most widely interoperable) token is the Euro. For the Internet industry, the corresponding standard token today is the IPv4 address. As the discrete "business ends" of their respective liquidity technologies, both kinds of tokens play an essential role in enabling the demand-driven and voluntary transfer of value between independent producers and consumers that may be widely separated in space and time. While there are some obvious functional differences between money and IP addresses, these are merely mechanical by-products of the fundamental dissimilarities that distinguish the type of goods that dominate the two domains. The domain in which monetary exchange evolved is largely composed of physical goods and time-consuming services that are inherently rival , which means they cannot be re-used after they have been exchanged. By contrast, the Internet domain is largely composed of inherently nonrival goods (including web sites, downloadable files, and online applications) which are not depleted by the process of exchange, and so may be enjoyed an indefinite number of times by an indefinite number of independent consumers.
5. From a historical as well as topological perspective, both liquidity systems may be regarded as overlay technologies. That means, they are distinct from but also dependent on the older infrastructures, institutions, and relationships that existed before the new liquidity mechanisms were widely adopted. The relationship between TCP/IP and network facilities is exactly like the relationship between a monetary system and the roads, trade routes, market towns, and other factors that early traders needed in order to find and interact with one another. This interdependence is not symmetrical however. This fact is reflected in the historical continuity between dominant centers of development for earlier generations of liquidity technologies, and high concentrations of the latest overlay technologies today. It is also reflected in the predictable criticisms that invariably accompany the emergence of each new liquidity mechanism, which consistently portray the latest overlay technology as, at best, a trivial source of value over and above the value embodied in the pre-existing physical inputs -- or at worst, a parasitic device intentionally designed to expropriate value from those who currently claim the raw inputs.
6. The critical importance of individual operator capability and know-how in multiplexing core resources is another common factor: ISPs use standardized packet-switching protocols and capitalize on differences in the timing, frequency and duration of customer requirements in order to support a much greater quantity and variety of connections and traffic flows than would be possible using other technologies. In the financial sector, industry members leverage differences in timing, frequency and duration of financial flows to support a much larger variety and volume of customer liquidity needs than would be possible using a less flexible, dedicated resource reservation arrangement. In both domains, exercising this capability tends to impose incremental system-wide burdens on all industry members, and multiplexing miscalculations can have widespread disruptive effects. So, the consistent exercise of prudence and good judgment by industry members is an essential requirement not only for business survival, but for the survival of the industry as a whole.
7. In order to reduce these systemic risks, both industries have experimented with a variety of different risk mitigation mechanisms. In the Internet industry this process can be observed in the constant review and development of IP address allocation policies, and the constant refinement of address assignment practices to match changing technologies and customer needs. In the monetary domain, formal industry participation rules and informal banking practices have undergone centuries of continuous fine tuning, as well as occasional wholesale replacement, at the regional, national, and international levels.
8. One important risk mitigation strategy in both domains is the requirement for new industry members to demonstrate their need for resources, with "need" meaning actual possession of other means necessary to engage in the industry's most fundamental and defining activity, which is creating liquidity. This typically means that the new industry member must first make a credible, public commitment of resources, for instance by showing that they have all of the physical assets, operational procedures, and other resources in place to be an effective provider of liquidity -- either for themselves, or for other individuals and institutions. Since such resource commitments tend to be costly, and their value tends to vary over time in part based on the fortunes of the entire industry, this requirement has a secondary effect: it encourages individual industry members to act in ways that have a positive effect on the long-term industry survival. Economic historians and contemporary monetary policy authorities tend to identify this practice as a feature of the "micro-prudential" approach to liquidity industry risk management. Micro-prudential coordination mechanisms have played an important role in maintaining financial sector stability since the self-governing "bankers club" arrangements of the 18th-19th century, and are a key ingredient in the Basel Accords that define current international banking best practices.
Finally, in the comparison, the industry-wide distribution of the measured resource in both cases is strongly influenced by the same three factors:
- Industry-wide coordination policies that are directly or indirectly defined by industry members
- Varied strategies and commercial practices of individual industry members themselves
- The overall quantity and diversity of both the liquidity system's active participants and the exchangeable things that make up the "real" economy.
Taken together, these points of symmetry suggest that these two industrial sectors -- which we call the "monetary liquidity" and "digital liquidity" industries -- bear strong similarities. As subsequent articles will reveal, they also behave quite similarly to each other in terms of the relationships that hold system components together, as well as the kind of changes that systems of both types have undergone over time. One main difference, however, is that monetary liquidity systems are much older and more diverse than the TCP/IP protocols that provides the foundation for today's Internet. The long, diverse, and well documented history of past monetary liquidity arrangements that have existed at different places and times provides an opportunity for us to consider whether there might be any relevant lessons that we could apply -- any useful innovations that we might adopt, or major blunders that we might avoid -- given the current circumstances in our own industry.
Of course, each of the points listed above merely glosses a much richer, but equally symmetrical set of industry-specific stories. In future articles, we intend to dig deeper into some of the historical and technical details of this surprising parallel.
Methodology
The European Central Bank (ECB) provides a wealth of useful data on EU-area national financial sectors. However, they do not publish capital reserve or asset value data for individual financial institutions -- at least not publicly and consistently on a EU-wide basis. What they do provide publicly, consistently, and regularly are:
(a) the total number of monetary financial institutions presently in operation in each EU economy
(b) national-level totals for the combined bank assets held by all such institutions
(c) national-level values for the aggregate share of total national-level bank assets accounted for by the five largest banks in each EU member state (also known as "CR-5" values), and
(d) national-level Herfindahl-Hirschmann Index (HHI) numbers that provide a composite measure of the overall distribution of bank assets across all industry members. Note: this is the same HHI metric that was used extensively in a presentation given by RIPE NCC Chief Scientist Daniel Karrenberg at RIPE 56 [1].
Results
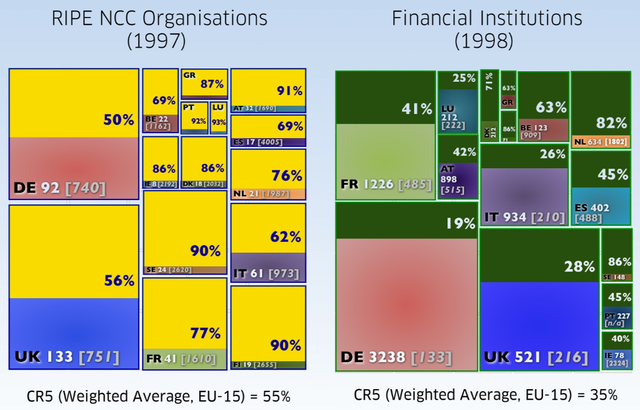
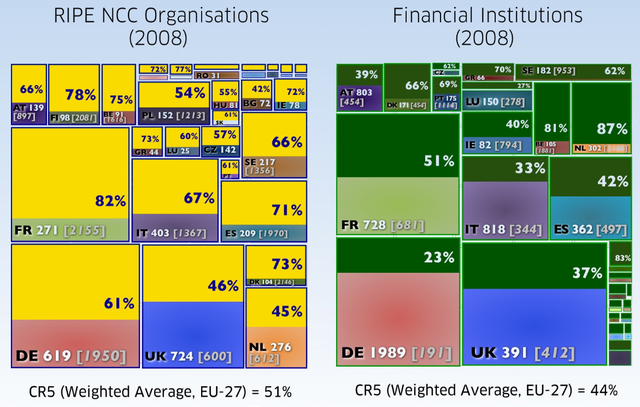
In the illustrations below we provide two side-by-side comparisons of equivalent portions of the universe of RIPE NCC IPv4 address recipients on the left and the EU monetary financial sector on the right. This is done for two different points in time: 1998 and 2008. 
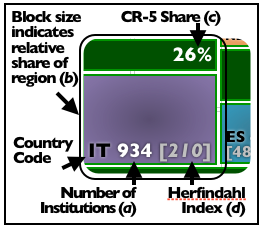
Each country is made up of two squares:
- The top area (yellow on the left and green on the right) shows how much of the resources is held by the top 5 organisations in that country (also referred to as CR-5).
- The square underneath shows the country code, the total number of industry members in that country and the HHI score.
The size of the country’s area in the overall image represents the share of total Eurozone-area resources held by industry members from that particular country.
In Figure 1, the distribution of IPv4 address space handed out by the RIPE NCC to its members is matched against the distribution of assets across banks within the 15 members of the European Monetary Union (EMU) as of 1997-1998 [2].

Figure 1: Comparison between RIPE NCC organisations and financial institutions in 1998
In Figure 2, you can see the same comparison, but now for 2008. At that point, the EMU was comprised of 27 countries.
It is interesting to see that the number of financial institutions and the number of IPv4 recipients grow at a similar pace. On the other hand, the HHI score of the financial sector has increased over time (that mean it is getting more concentrated), whereas the HHI factor for the Internet industry has decreased for many countries (that means it became less concentrated).

Conclusion
After we compared the Internet industry with other industries, we found that the financial sector shares many characteristics. We also found surprisingly many similarities in the way resources are distributed. In fact the two industries are very much alike.
As this and previous studies clearly reveal, it is common for industries to have a relatively small number of organisations that hold a fairly large share of total resources or output [3]. Nevertheless, the potential consequences of excessive concentration in an industry that is as critical to overall economic health as liquidity providers, needs very careful consideration. Based on the latest statistics available on monetary liquidity providers, the Internet sector still has some way to go in many places to achieve the level of diffusion that is common among financial services providers. However, it is worth recalling that less than 30 years ago, there were approximately 27 telecommunications service providers in those 27 European countries, and each of them with a 100% national market share. Today, even if one considers only the top 1% largest IPv4 holders in the RIPE NCC service region, the number of institutions within that subset is more than twice as large as the 27 telecommunications providers that existed before TCP/IP was widely adopted. In addition to that, the rate of new entries in the Internet sector remains high in most places, making the distribution of IPv4 ever more diffuse with each passing year. Given the continued strong influence of that older resource distribution pattern on the current landscape of IP address deployment opportunities, the current state and trend of IPv4 diffusion stands as a remarkable testament to the advantages of TCP/IP-based networking.
It is also important to note that the concentration on top has no significant impact on the ability to join the industry as a new member. Nor does it mean that the organisations once on top stay there forever. As we already showed in the first article in this series, companies move up and down in the system.
Those who might imagine that IPv4 address has been unfairly rationed to small operators should compare the rates of entry in the banking sector, where the only truly scarce barrier to entry is "discretion", and the rate of entry in the Internet sector. Would any more liberal system that imposed even lower discretionary obligations on Internet industry members have been sustainable? Would it have been fairer to all stakeholders? We will investigate this more in future RIPE Labs articles.
Notes
[1] One important methodological caveat deserves mention here. For this study, we use the ECB metric of bank assets as a proxy for the value of bank capital reserves , which is not publicly available. However, in banking parlance, the term "assets" denotes loans, or external liquidity commitments, which individual industry members have broad discretion to extend up to a limit dictated by either the behavior of their own liquidity providers, or else by external capital reserve ratio requirements. By contrast, we described IPv4 allocations and their underlying "need-based" justifications as equivalent of a bank's capital reserves. Thus, per the terms of our own description, a comparison of IPv4 and bank asset distributions would equate one kind of liquidity-enabling internal resource to the external liquidity commitments made possible by a different kind of internal liquidity resource. Although this mismatch may reduce the confidence and applicability of the results described herein for some questions, we feel that the broadly consistent risk-weighted asset volumes-to-capital reserve ratios that are dictated by the majority of national and international bank operating rules provides sufficient confidence to justify their comparison to national-level IPv4 concentrations, as in the illustrations above.
[2] Due to limitations in banking sector data, the first match-up focuses only on industry members that are based in one of the 15 Eurozone economies, and illustrates the distribution of bank assets at the end of December 1998 alongside the distribution of IPv4 addresses at the end of 1997. The second illustration captures both industries at the same moment at the end of December 2008, and incorporates individual firm-level data for all industry members that are based within the 27 member states of the European Union.
[3] An abundance of evidence of such patterns can be found among the numerous recent studies of power-law degree distributions in empirical data. Excellent recent overviews of this research are available in Clauset, Shalizi, and Newman, Power-Law Distributions in Empirical Data (2009) and Gabaix, Power Laws in Economics and Finance (2009).


Comments 0
The comments section is closed for articles published more than a year ago. If you'd like to inform us of any issues, please contact us.