IP anycast provides DNS operators and CDNs with automatic fail-over and reduced latency by breaking the Internet into catchments, each served by a different anycast site.
Unfortunately, understanding and predicting changes to catchments as sites are added or removed has been challenging. Current tools, such as RIPE Atlas and commercial equivalents, map from thousands of vantage points (VPs), but their coverage can be inconsistent around the globe.
We have developed a new, open-source anycast catchment mapping technique, Verfploeter, which uses active Internet Control Message Protocol (ICMP) echo (ping) probing from within the anycast service to an IPv4 ‘hit-list’ of active hosts on the Internet.
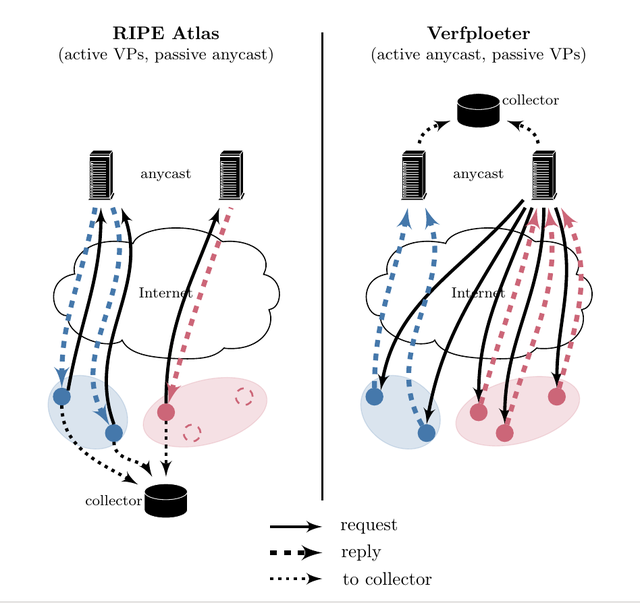
Figure 1: Traditional catchment mapping from active physical VPs (left); and using Verfploeter with queries originating in the anycast system (right)
As each distant host in the hit-list responds to pings, the ICMP echo replies are routed to the anycast prefix, and therefore arrive at the various anycast sites. By recording and analysing traffic arriving at each site, we can then determine detailed catchment mappings.
Our technique provides coverage from around 3.8M virtual VPs, which is just over 430 times the 9,000 physical VPs in RIPE Atlas, providing coverage of the vast majority of networks around the globe.
Although establishing how the majority of the Internet is routed to your service is interesting, the results still need to be calibrated to your user base. This can be done by analysing measured network load information from (historical) service logs from either the same service or from a different service with a similar user base. This allows you to ‘predict’ the division of load over the anycast service.
Using these techniques, we evaluated the new anycast deployment of the B-Root DNS service where we first measured the full anycast catchment, which shows 87.8% would be served by the LAX site. After performing calibration using service logs from B-Root while it was still using unicast, we estimated 82.6% to be served by the LAX site after enabling a second site. This was remarkably close to the 82.4% we measured after the actual deployment.
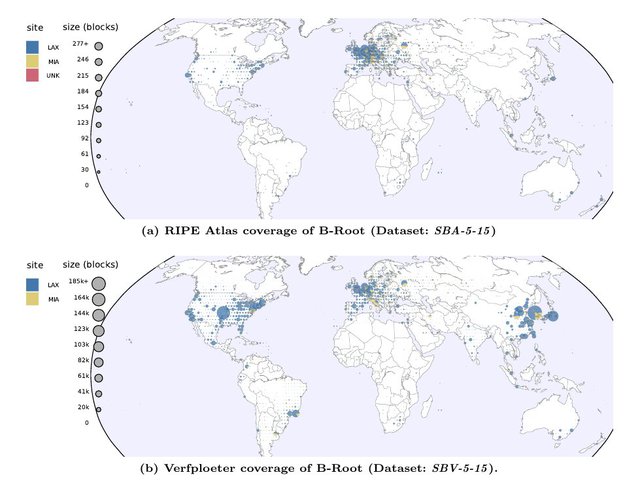
Figure 2: Geographic coverage of VPs for RIPE Atlas and Verfploeter for B-Root, in two-degree geographic bins. The pie in each bin is coloured by site (blue: LAX; yellow: MIA; red: other). Circle areas show the number of address blocks (Verfploeter) or VPs (RIPE Atlas) at different scales
We additionally show that greater coverage is made possible by Verfploeter’s active probing and our improved catchment mapping technique is necessary to see routing differences in regions like South America, China, and Africa, that have sparse coverage from other active measurement platforms.
Finally, we were able to study catchment mappings within Autonomous Systems (ASes) and the prefixes they announced for the first time. We found that ASes announcing more prefixes are likely to see more anycast sites, indicating that these ASes are internally split in terms of routing.
Additionally, we studied the size of announced network prefixes and found that 80% of prefixes smaller than a /16 reach are routed to a single site and the larger the prefix announced the more likely it is to see more anycast sites.
Read the full report [PDF 5.2 MB] and download the Verfploeter software and instructions on how to use it for free at the ANT Lab.
Note: This article was originally published on the APNIC blog.

Comments 0
The comments section is closed for articles published more than a year ago. If you'd like to inform us of any issues, please contact us.