After the publication of the Critical Infrastructure Protection report more than ten years ago, we asked ourselves how critical infrastructure companies are interconnected, how resilient these connections are, and to which extent they are dependent on foreign entities.
In 2002, the Netherlands started the Critical Infrastructure Protection (CIP) project with the objective to develop "an integrated set of measures to protect the infrastructure of government and industry”. In the CIP study, critical infrastructure includes business enterprises and public bodies that provide goods and services essential for the day-to-day lives of people in the Netherlands. The critical infrastructure is divided into 12 critical sectors, with Internet, Communications and Communications (ICT) being one of them (see Figure 1 below).
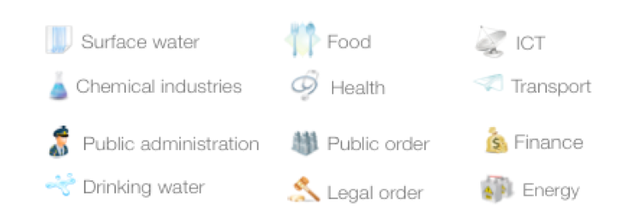
In this article, we look into a specific aspect of the critical infrastructure in the Netherlands, namely how organisations that are considered critical infrastructure depend on Internet services, and to which extent these Internet services are part of a national IP infrastructure in the Netherlands. To this end, we mapped Dutch critical infrastructure organisations to their presence on the Internet, and analysed how the organisations are interconnected via networks in the Netherlands versus networks outside the country.
Previous Studies
The presence of organisations on the Internet is defined by the IP resources they use, and how their networks are connected to other networks. The interconnection between networks is governed by the BGP routing protocol .
In 2012, a joint project with two universities and the Federal Office for Information Security ( BSI ) classified the German “ national Internet ”. Their methodology started with the list of IP prefixes allocated to organisations registered in Germany. From this information they found the originating Autonomous System Numbers (ASNs) and then their interconnections using BGP dumps.
We took a slightly different approach in our research. We didn't have access to privileged information (including, for instance, the IP blocks used internally by critical infrastructure organisations in the Netherlands). And we decided to include ASes located outside the Netherlands that provide web and email services for organisations classified as critical infrastructure in the Netherlands .
Approach, Methods and Techniques
To discover and map the interconnections between the critical infrastructure organisations, we identified three phases in our analysis: We started by identifying the Internet presence of the organisations: their AS numbers or the AS numbers of the entities that act as their proxies (ISPs). Once this list was created, we looked at how these ASes are interconnected and, finally, we described a method for visually mapping them.
Finding the Data Points
Identifying the organisations in question involved a lot of manual work. For that we used two different approaches:
Bottom-up approach
The RIPE NCC publishes an authoritative list containing all AS numbers assigned to organisations in the RIPE NCC service region. We identified all AS numbers assigned to organisations in the Netherlands. This resulted in a comprehensive list of 727 organisations.
From that list we had to select all those organisations active in a critical sector as defined by the Dutch government in the CIP project (see Figure 1 above). This was no trivial task:
We entered all those 727 AS numbers into RIPEstat to determine their domain name and from that the orgnisation name. We then checked the web sites of all these organisations to find out if they are active in one of the 12 sector above. After that filtering process, 335 entries remained in our list.
At this point we realised that around 80% of the organisations in our AS list are active in the ICT sector and therefore maintain their own ASN. That only left 67 organisations in the other 11 sectors that have their own AS. All the other organisations in these sectors must use a “proxy AS”, such as an ISP to intermediate their Internet presence. This brought us to our second approach:
Top-down approach
We selected a number of organisations from each critical sector (using data from the Dutch Chamber of Commerce, Google, Wikipedia, etc.). Then we looked up the ASNs assigned to them (via the organisation's name, domain name (A, AAAA and MX records) and corresponding IP address).
Connecting the Dots
The next step was to determine how these ASNs are inter-related. CAIDA and UCLA Internet Research Lab both provide Internet topology maps. These maps show all the links between AS pairs. For our analysis, we selected the UCLA IRL topology map, because it was the most recent of the two.
In the initial mapping of the critical infrastructure in the Netherlands, we selected all links for which both nodes were part of our combined list of ASNs (as described above). At this stage we did not include any other providers these organisations are connecting to. That resulted in a graph showing many disconnected nodes. This is an interesting observation as it shows that large parts of the critical infrastructure in the Netherlands is dependent on intermediary or transit nodes outside the Netherlands.
Since the goal was to build a graph that connects all the critical infrastructure ASNs, the next step was to add a provider for each ASN in our list (UCLA offered this information also) and re-run the selection process. That way the result was a much better image of the relations between the Dutch critical infrastructure ASes and its dependency on out-of-country intermediary or transit networks.
The final step was to visualise this information in a way that offers an overview of the relations per critical sector but which also allows to dive into more details if needed. For this study we considered Data-Driven Documents (D3.js) JavaScript library and Sigma.js library. For our purposes, Sigma.js library provided the visualistion methods that satisfied our needs: it gives a good perspective on each sector and allows to zoom-in seamlessly in an area for details. Placing the (proxy) ASes (those located outside the Netherlands) on the opposite side from those located in the Netherlands gave an even more intuitive representation of the AS interconnections.
Results
We produced network graphs for each critical sector and used them as input data source for further analysis (please see our report for more details). To give an example, let us look at the Energy sector which contains 3 sub-sectors: electricity, gas, and oil. Figure 2 below shows the ASN network graph for this sector with only direct links between each two ASNs taken into account. No providers are included.
It is clear that the graph is too disconnected to draw any conclusions. The distribution of links on each side is divided almost equally: 44% are ASNs located abroad (on the left side of the graph) and 56% are ASNs located in the Netherlands (on the right side of the graph). Please note the little flags on the interconnection points (you can enlarge the image by clicking on it).
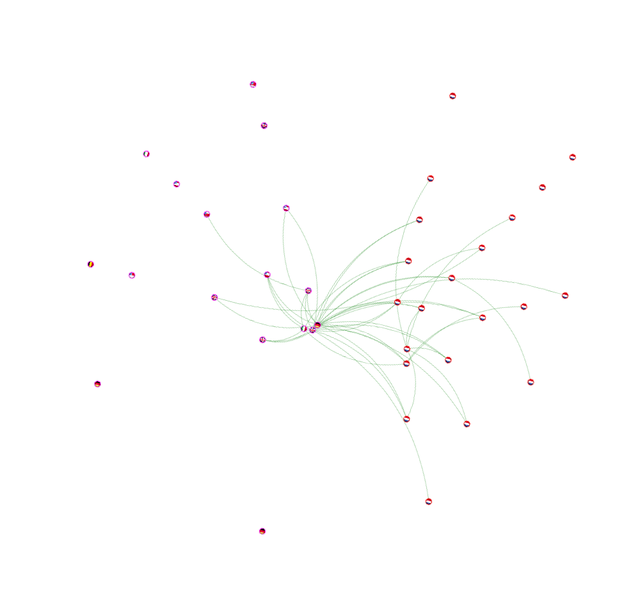
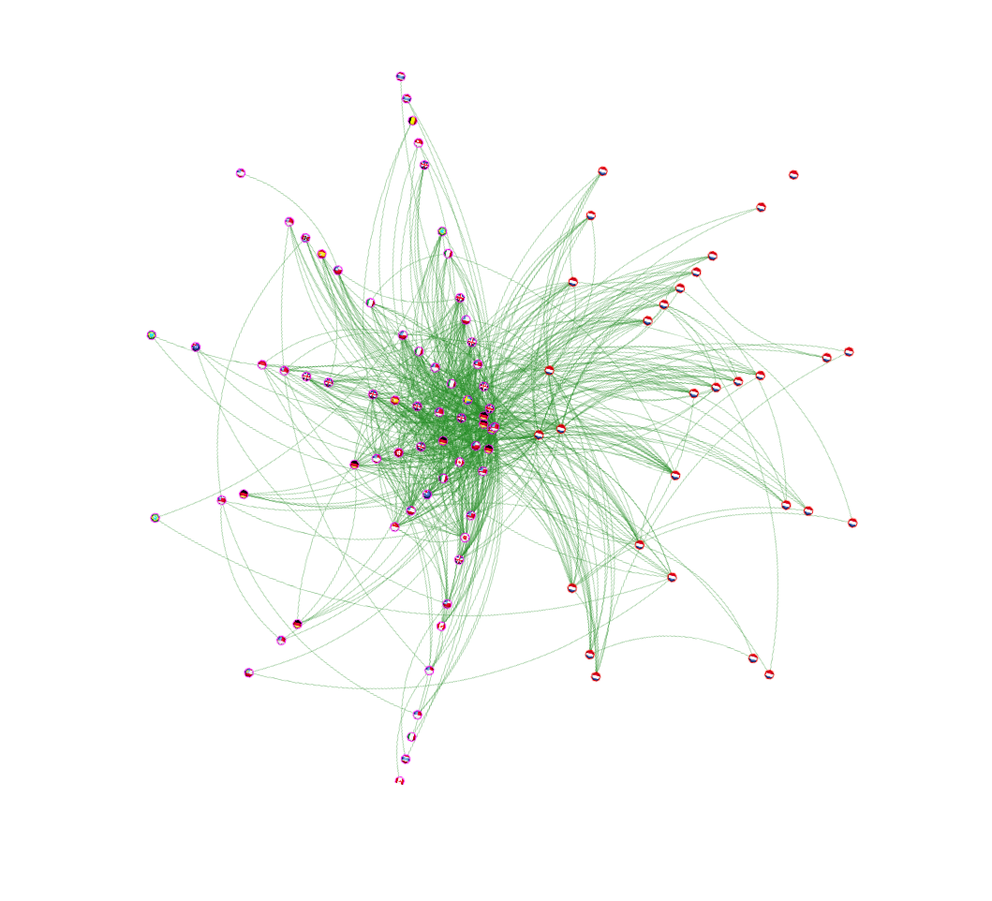
Figure 3 below shows the same graph after we added the direct provider for each AS. The graph is now more connected and also shows a different distribution of links: 69% are ASNs located outside the Netherlands, 31% are ASNs located inside the Netherlands.
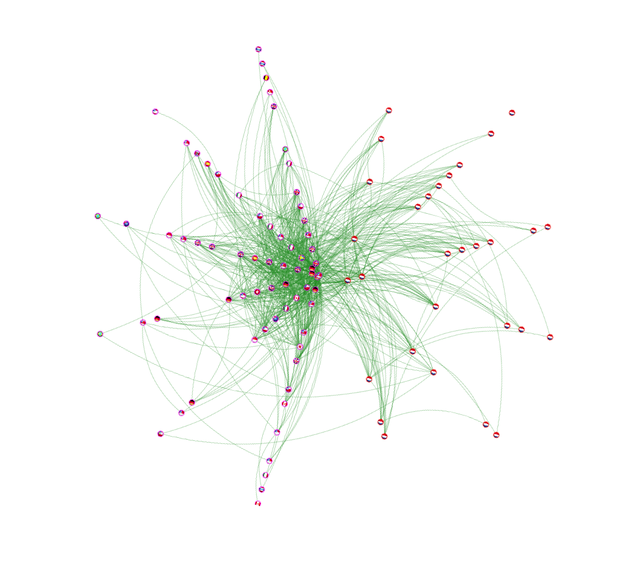
Although it is expected that each node will have at least one link (it will be the connection of the node to its provider), we still can find one isolated ASN on the right side of the graph: That is, according to RIPEstat, ASN 61013 (Alliander N.V.). Although Alliander N.V. is one of the largest companies in maintenance, expansion and adaptation of the gas and electricity network in the Netherlands, no IP prefix ever originated from this AS; instead their web server and mail server are hosted by British Telecommunications plc (ASN 5400).
Note that the examples above are specific to the energy sector. Examples for other sectors can be found in the full report .
Conclusions
In this research we mapped the representative critical infrastructure organisations in the Netherlands using two identification methods (bottom-up and top-down). The selected organisations were verified manually one-by-one so we have a high degree of confidence in the accuracy of the results. However, we only worked with public sources of information and thus we did not see physical, private and back-up links. A more comprehensive list of organisations can only be obtained with specialised information, or with privileged access to information, which would allow us to know what IP address space is actually being used inside every organisation.
We observed that many critical infrastructure organisations have reliable connections to the Internet (the native and proxy ASes are well interconnected), but many rely on providers outside the country for their communication needs.
If we would consider the imaginary scenario of an emergency in which organisations classified as critical infrastructure can only communicate using in-country links, then around half of them (those that use proxy ASes located outside the country) would be cut-off from the Internet. In this context it could be interesting to start a discussion about the security and privacy implications of having email and web servers of critical infrastructure organisations hosted with entities located outside the country, especially if those entities are from outside the European Union (EU) since they do not necessarily follow the same laws regarding data privacy and confidentiality.
Acknowledgements
The study was performed as a System and Network Engineering (UvA) Master thesis research project by Fahimeh Alizadeh and Razvan C. Oprea under supervision from Benno Overeinder (NLnet Labs) and Marco Davids (SIDN).

Comments 0
The comments section is closed for articles published more than a year ago. If you'd like to inform us of any issues, please contact us.