
RIPEstat will soon turn 10 years old, which I take as an opportunity to reflect on how RIPEstat came about, explain our new challenges and how we are tackling them.
The Product Life Cycle is an old but still widely used model for product development, first introduced by Theodore Levitt in 1965. Put simply, it describes the stages every product goes through during its lifetime. In its initial formulation, it defines four stages: Introduction, Growth, Maturity and Decline. Because the life-cycle depends on many factors, there can be different variations of the stages, but the standard cycle looks like a skewed Bell Curve:

Figure 1: A sample Product Life-Cycle graph
It's always interesting to see where a product is in the life cycle but the real benefit of this model is to understand what comes next, because that helps to make informed product decisions.
RIPEstat’s Stage in the Product Life-Cycle
At what stage is RIPEstat in its product life-cycle? Since the original model is measured in sales, I replaced sales with user engagement to adapt it to our non-for-profit situation and took usage as the closest metric to reliably capture user engagement.
In 2011–one year after RIPEstat was launched–we had an average of 7,000 API requests per day. In 2019, the daily average was up to 50 million requests and our current 2020 numbers shows that RIPEstat is serving a whopping 120 million requests per day (If you are interested in more details, there is a frequently updated graph with daily user requests that can be found here). In comparative terms, this usage makes RIPEstat the (externally) most queried API service at the RIPE NCC with the RIPE DB API ranking second at 50 million requests per day and excluding K-root.
Judging by these numbers, we can certainly say that RIPEstat passed the Introduction phase and has clearly not yet reached Decline. A jump from 50 million to 120 million is impressive, but I would not expect this rate to double again, which places the service somewhere at the Maturity stage.
It is actually hard to say how long RIPEstat will stay at the Maturity stage, but if we keep the service doing what it was intended to do, the next stage will be Decline! In other words: the value that RIPEstat provides to users now will diminish in the future. Nobody wants that, right? So, product innovations to the rescue!
The Original Idea And New Challenges
Before I jump straight to the innovations, I want to quickly explain why RIPEstat was created - a small tribute to the past years.
Pre 2010, the landscape of information services on Internet number resources was pretty scarce and although there were already useful data sets/sources, they were scattered across different platforms. Following an idea from Daniel Karrenberg to allow unified access to various data sets/sources, my colleagues at the RIPE NCC and among them especially Rene Wilhelm, who saw the need for an UI, developed REX (“Resource EXplainer”), which became the prototype for RIPEstat. In the time that followed we continued to work on that idea and matured the service into what it is now, a large-scale information service with three complementary interfaces:
- RIPEstat Data API: This is for the advanced, data-oriented users building applications
- RIPEstat Widgets: The visualisations on top of the Data API
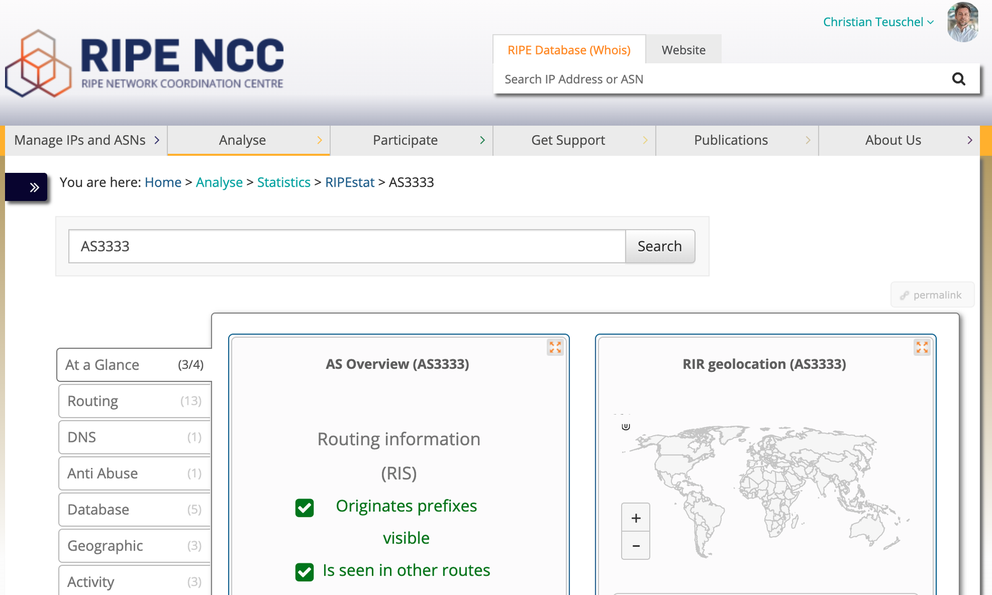
- RIPEstat User Interface: The web application where the Data API and widgets come together
Numerous data sources were added and with that new data calls and widgets were created. It can be said that we succeeded in making all three interfaces better, which might also find some reflection in the growing usage.
Over the years, the success of this development became also its biggest issue. More data sets meant more maintenance and curation, and we learnt the hard way that every data set requires expertise on the data and not only storage and distribution facilities.
A disadvantage of growing features has also shown to be true for our user interface, in the first few years the user interface rendered all available widgets upon a single lookup. A bit later, we started to group them in tabs but that only helped to protect the user and the browser from information overload. More often than I’d like it we got feedback that the RIPEstat's user interface could be improved.
In a nutshell, service sustainability and finding the right information (reducing time to insight) are the biggest challenges facing RIPEstat at the moment, and here's how we are tackling them.
Collaborations on Service Level
Collaborations and data sharing have always been an essential part of RIPEstat, which also ties back to its original idea. There are numerous examples of different parties that collaborated with us on data over the years ( e.g. M-Lab, Broadbandchecker, RIS). We are also expecting to see more collaborations of this kind in the years to come.
On the other hand, collaborating on service level is still a new thing for RIPEstat, and we kicked that off with our colleagues at APNIC. The idea behind the collaboration is to use RIPEstat technology to build information services that help us and our partner improve service user segments. In this case, our collaboration with other RIRs meant a better service for regional users by adding a focus on regional events or an UI in a language other than English, for example.
Our first two collaborations took place last year with APNIC in May and LACNIC in August and were followed by AFRINIC in March this year. The newly created information services can be found here:

Figure 2: APNIC's NetOX

Figure 3: LACNIC's InfoRedes

Figure 4: AFRINIC's AIRRS
These collobarations allow us to join forces with our partners and share expertise and service efforts. Working with our RIR partners was a very positive experience and I believe that in the future our collaborations could go beyond the scope of RIRs.
New UI Concept
Last year, we started to rethink what it would mean to improve the RIPEstat's user interface and my colleague Stephen Suess wrote an excellent article on these improvements.
RIPEstat's UI development are following five guiding principles:
- Responsive and mobile friendliness
- Self contained “App”
- User-driven presentation/configuration
- Universal search context (resource, range, etc applies to all displayed elements)
- Shareability (via some or all of the following: url, stored config, file/image, embedding)
Every idea for the UI was validated against these principles, if an idea did not improve any of the principles it was discarded. This process allowed us to be lean and focused and iterate quickly.
One of the principles that I would like to highlight is the “user driven presentation” as I think this is key to get a better user experience when it comes to finding the right information and shortening the time to insight.
Instead of widgets, the new user interface uses information cards. The concept is similar to a widget as the card is a miniature UI representing specific data/information. The difference with an ordinary widget comes from the card’s ability to switch between different level of details and data complexity.
For example, a card that represents routing visibility information would on the fist level show whether or not a resource is visible, on a second level it would provide details on the routing tables that the visibility is based on, and on a third level it would give more insights into the peers from which the routing data was collected. The navigation between these levels is done either by the users or by the system.
The result for a lookup, which is in the current UI a set of widgets, will be done following the concept of information paths. An information path is a representation of a set of information cards (at their various levels of details) that satisfies a specific information need or a use case.
The goal is that we will only show relevant information for someone’s use case. For example, if you troubleshoot a routing issue of one of your prefixes, the system should not bother you with holder details of your AS.
In order to make that happen, the new UI is going to be smarter in what information will be shown to the user. This will be partially done by us defining and bootstrapping these information paths but also by continuous improvements through the analysis of what paths users take to find the right information.
If you want to know more about the new UI, join us today between 12:00 and 13:00 (UTC+2) during for "A First Look at the New RIPEstat", a session organised in parallel of RIPE 80. I heard there will also be prizes to win. For us, it will definitely be a win if we get to meet some of our users personally, which we are all very excited about :)
All meeting details are available on the RIPE 80 website.
Finally, I hope these ideas make a good contribution to RIPEstat and that it will continue to provide value to our users.
Stay safe and healthy! ❤️


Comments 0
The comments section is closed for articles published more than a year ago. If you'd like to inform us of any issues, please contact us.