This is the fourth in a series of articles in which we look at traffic statistics at Internet Exchange Points during the European Championship currently taking place. This time we looked at IXP traffic during the quarter-finals.
Please also note the other articles in this series:
- Internet Traffic During the European Championship 2012
- Internet Traffic After First Round of Euro 2012 Matches
-
Internet Traffic During Euro 2012 - Group Stages
The Euro 2012 football tournament has reached the quarter-final stage and, with Euro-IX, we continue to look at the traffic exchanged at Internet Exchange Points (IXPs) around Europe during the event.
These IXPs connect ISPs and play an important role in the global Internet fabric. IXPs connect the networks of Internet Service Providers (ISPs) to permit the exchange of Internet traffic. As we noted previously, the IXP traffic is not necessarily indicative of the overall Internet traffic in a country or region, as ISPs can (and do) also interconnect outside of IXPs.
In our last article, we noted that clear patterns emerged in the group stages that in some cases became more pronounced as the matches became more crucial. For the knockout stages, we can see if the patterns continue to become more noticeable, and we can also compare how the graphs look at bigger and smaller IXPs. The quarter-finals also gave us a penalty shootout, which gives us a different match pattern to look at.
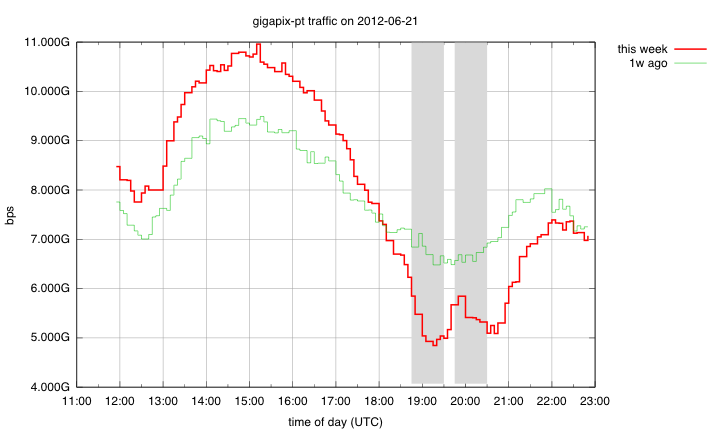
On Friday, 21 June, Portugal played the first quarter-final against the Czech Republic. At the GigaPIX exchange in Portugal, the familiar double dip in the traffic is noticeable (see Figure 1). At NIX-CZ, on the other hand, we get the opposite double bump during the match (see Figure 2). As explained in an earlier article, big events like Euro 2012 could potentially cause increases or decreases of traffic exchanged at an IXP, depending on who and how ISPs interconnect and how video streams are distributed. The lines for NIX-CZ are much less dramatic than for GigaPIX, and it is worth noting that the Czech exchange carries much more traffic than the Portuguese exchange.
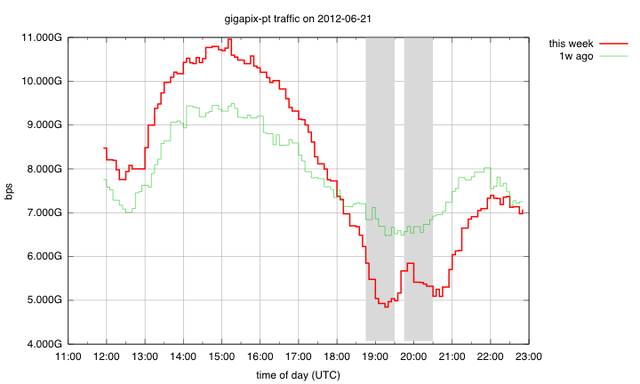
Figure 1: Traffic seen at GigaPIX during Portugal v Czech Republic match on 21 June 2012
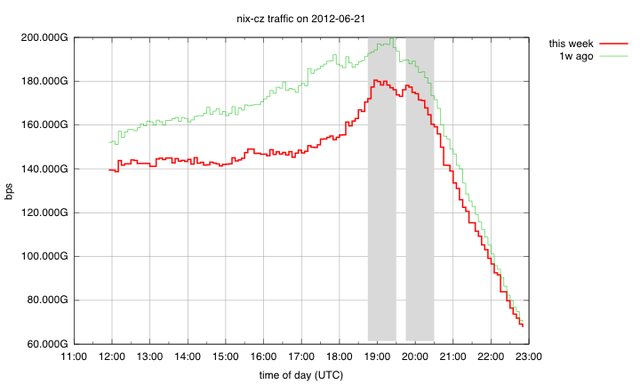
Figure 2: Traffic seen at NIX-CZ during Portugal v Czech Republic match on 21 June 2012
We can typically see patterns for larger IXPs to show much less noticeable variations from the norm then the IXPs that exchange less traffic. An example is the high-volume DECIX exchange in Frankfurt that shows only slight traffic abnormalities around the Germany v Greece game on Saturday, 22 June (see Figure 3). The 2 features that are noticeable are the increase in traffic around half time and traffic staying at the same level for about half an hour after the game before showing the regular evening decline. The much smaller (in terms of volume) DECIX exchange in Munich shows traffic already atypically started to decline in a two-hour period before the game with the clear double dip when the match was being played (see Figure 4). As each IXP is unique in whom peers with whom across the peering LAN, and how much traffic is exchanged there exactly. Having a diverse set of IXP helps in seeing different effects of large events.
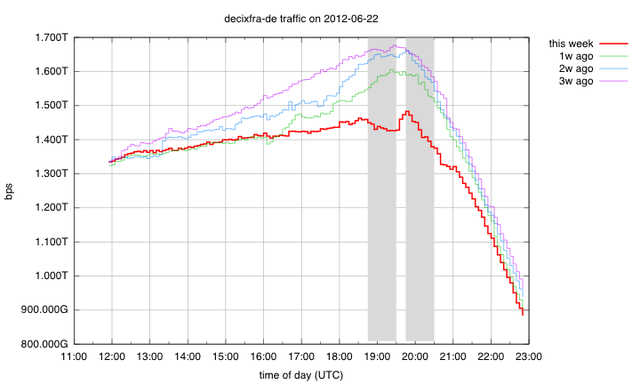
Figure 3: Traffic seen at DECIX Frankfurt during Germany v Greece match on 22 June 2012
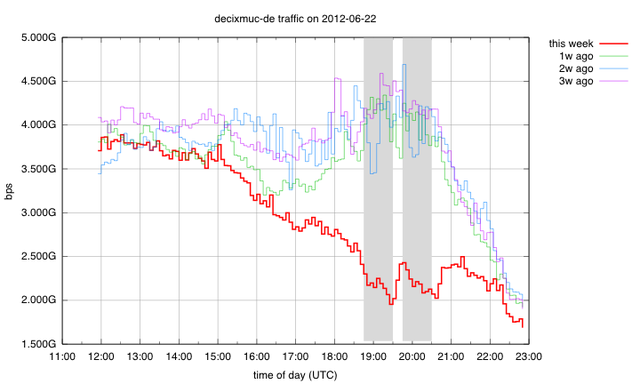
Figure 4: Traffic seen at DECIX Munich during Germany v Greece match on 22 June 2012
On Sunday, 23 June, traffic levels at CATNIX in Spain showed a variation that we hadn’t noticed before. Traffic levels dropped right when the Spain v France game started (see Figure 5). Here, however, the typical increase in traffic after the game finished is not present.
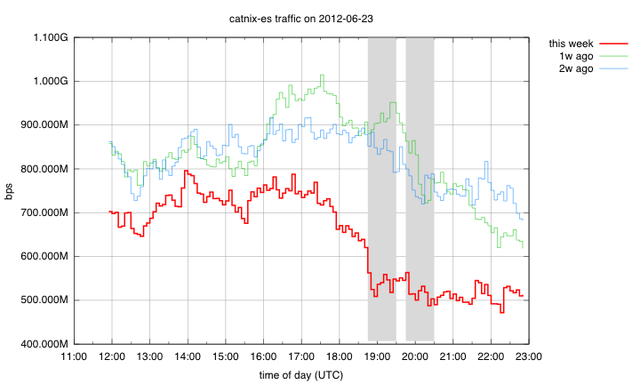
Figure 5: Traffic seen at CATNIX during Spain v France match on 23 June 2012
The England v Italy game on Sunday, 24 June, provided the tournament with its first penalty shootout, and in Figure 6 we highlight the two halves of normal time, the periods of extra time and the penalty shootout. The high-volume LINX exchange in London had been typical of many of the larger exchanges in not showing much variation from the norm throughout the tournament. For the England v Italy game, however, we do see quite noticeable variations, as the periods between 1st and 2nd half, and between regular and extra time show noticeable traffic upticks. Most notable though is the uptick in traffic levels for about half an hour after the end of the penalty shootout, whereas normally traffic decreases during this time of day. The fact that patterns at are becoming more visible, even at the biggest exchanges, is an indicator for the increased effect of Euro 2012 as it progresses. It also coincides with the highest television audience for a football match on the UK’s national broadcaster since 2004.
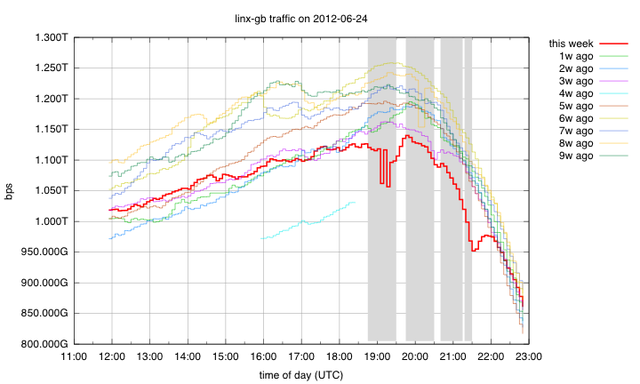
Figure 6: Traffic seen at LINX during England v Italy match on 24 June 2012
We also see an unfamiliar pattern: During the first half we see 2 temporary sharp declines in traffic volume. As the data we are looking at is the average traffic level during a 5 minute interval, it’s impossible to say anything about these drops at a finer time granularity. These drops are unlikely to be related to the football match being in progress, but could possibly be related to traffic temporarily not being exchanged on the IXPs public peering LAN. If you have an explanation for these drops, we'd love to hear your thoughts, please leave us a comment below.
With only three matches to be played at Euro 2012, we’ll continue to look at the IXP data to see if the same patterns emerge and to see what effect it had on traffic as the stakes in the tournament become higher and higher.
Participating IXPs with links to their statistics pages:




Comments 4
The comments section is closed for articles published more than a year ago. If you'd like to inform us of any issues, please contact us.
Rob Evans •
Given the LINX's graphs don't show the drops in the first half of the England v Italy match, unless they've been smoothed out by data aggregation, have you considered it might be a glitch with the stats collection? https://stats.linx.net/cgi-pub/exchange?log=combined.bits
Maria Isabel Gandia •
The traffic level at CATNIX didn't probably increase right after the match because the night of the 23rd June there's a traditional feast in Catalonia (Sant Joan) where adults and children throw fireworks and firecrackers till midnight and some go to the beach. People were probably outside after the match, celebrating the victory and Sant Joan at the same time.
Yair Shapira •
You can find some interesting results from the semi-finals and final in our two last posts here - http://blog.divinetworks.com/. You'll see that indeed total traffic declines, but live traffic triples (at least in Bulgaria). So on one hand "normal" Internet browsing is abandoned, but tens of thousands of users turn to the net as an alternative to TV.
Freek Dijkstra •
I captured screenshots of the AMS-IX on 19 june 2004 (soccer match Czech republic - Netherlands) and on 14 june 2010 (soccer match Denmark - Netherlands). See http://imgur.com/a/IZ48k#1. In 2004 the game was in the evening, and there was a small but noticeable dip in the traffic, presumably because people were watching the game instead of browsing the web. In 2010, there was a small spike. Presumably because people were watching the soccer game at work (the match was during daytime). This is more or less confirmed by two graphs of the traffic between the SURFnet network and the Dutch public broadcasting organisation (NPO), which rose from about 4 Gb/s to 16 Gb/s during the match. Unfortunately, I can't full explain the graph: the peak only last 1.5 hours, while I presume the match lasted 2 hours including break.