
In this article we show some interesting traffic graphs seen at IXPs during the first round of matches.
Please also note the other articles in this series:
- Internet Traffic During the European Championship 2012
- Internet Traffic During Euro 2012 - Group Stages
- Internet Traffic During Euro 2012 - Quarter-finals
- Internet Traffic During Euro 2012 - Final Conclusions
- Internet Traffic During the 2012 Olympics
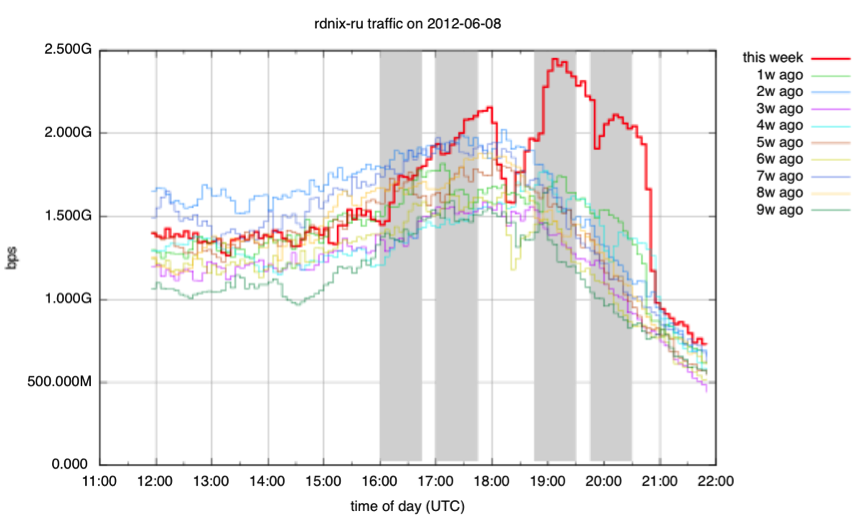
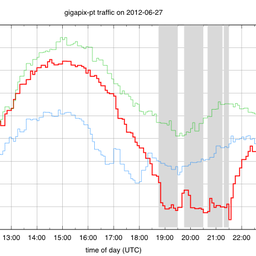
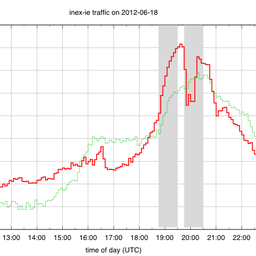
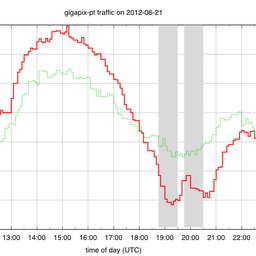
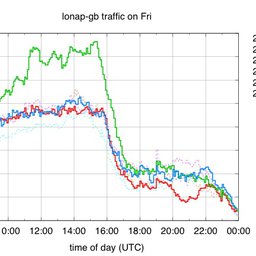
As described in the first article of this series Internet Traffic During European Championships 2012 , with the help of the European Internet Exchange Association (Euro-IX) we’re collecting the Internet traffic data from Internet Exchanges around Europe, showing the traffic that goes through Internet Exchange Points (IXPs) during tournament games. We also compare the traffic against the same times in previous weeks to see if there are notable differences. With the first round of matches at Euro 2012 now completed, we can show some of the first graphs with IXP traffic statistics from before, during and after matches (the two halves of each match are highlighted in grey).
So far, we have seen some abnormal traffic patterns occurring at the same times as matches (correlation is not necessarily causation though!). One pattern we saw repeatedly is: traffic decline at the IXPs when matches were in progress, while there are often spikes at half time and immediately after matches have concluded. It is possible that this relates to people going “offline” and viewing the match on regular television and going online briefly during halftime and again after the match.
Another pattern we saw was that, on some exchanges, traffic increased when matches were in progress. This pattern was most noticeable on the Rostov-on-Don Internet Exchange in Russia (see Figure 1) and the Vienna Internet Exchange in Austria (see Figure 4). A logical explanation for this is online viewing of games. The fact that we don’t see this at all IXPs probably indicates that in these cases, traffic caused by online viewing doesn’t flow through IXPs in sufficient quantities to be visible. This doesn’t mean games are not watched online. Traffic related to online viewing of matches could be primarily exchanged via private interconnects .
Additionally, the use of content-delivery platforms can also minimise the amount of traffic exchanged between the network that provides the online data stream and the networks where end users are situated. This can be achieved by sending a single data stream from a data stream provider to the network where the end users are situated. Within the end user network this single stream can be re-distributed by the content-delivery platform to all end users that request it (a comment in the original article shows that this is indeed the case in the Czech Republic).
If there are other factors at play in the information shown in the graphs below, what are they and would we see similar graphs for other widely viewed events? How important is the availability of free-to-air television on the traffic we can see at the IXP? And how useful is it for you operationally to know when there could potentially be abnormal traffic due to large events such as Euro 2012?
Finally, we were delighted that since the original article, a number of IXPs have agreed to join the project, and we’ll be looking at their data through the rest of Euro 2012. All data we use is publicly available, and you can follow the links in the list of participants below to see statistics from the individual IXPs.


We're curious to see if we will observe any changes when games are being played in parallel and also when the knock-out phases start.
Participating IXPs with links to their statistics pages:


Comments 0
The comments section is closed for articles published more than a year ago. If you'd like to inform us of any issues, please contact us.