

Comparing ASN rankings by spam volume from two different data sources, CBL and PSBL (with a side trip to the University of Texas Computer Science Department), indicates there is enough correlation to have confidence in the rankings.
 In a previous article,
Internet Cloud Layers for Economic Incentives for Internet Security
,
we provided a table of the biggest spamming organizations in the world.
How confident are we of that table?
Well, the CBL volume data we used for it comes from two different CBL spam traps.
But we can go further.
In a previous article,
Internet Cloud Layers for Economic Incentives for Internet Security
,
we provided a table of the biggest spamming organizations in the world.
How confident are we of that table?
Well, the CBL volume data we used for it comes from two different CBL spam traps.
But we can go further.
CBL and PSBL
In addition to CBL ( Composite Blocking List ), we also have volume data from PSBL ( Passive Spam Block List ), which we can compare, as in Table 1 below.
| ASN | CC | Description | ASN | CC | Description | |||
| 1 | 9829 | IN | BSNL-NIB | 1 | 7643 | VN | VNPT-AS-VN | |
| 2 | 24560 | IN | AIRTELBROADBAND-AS-AP | 2 | 9829 | IN | BSNL-NIB | |
| 3 | 7738 | BR | T da Bahia S.A. | 3 | 24560 | IN | AIRTELBROADBAND-AS-AP | |
| 4 | 7643 | VN | VNPT-AS-VN | *4 | 17974 | ID | TELKOMNET-AS2-AP | |
| 5 | 6849 | UA | UKRTELNET JSC UKRTELECOM | *5 | 2856 | GB | BT-UK-AS | |
| *6 | 27699 | BR | T DE SAO PAULO SA | 6 | 25019 | SA | SAUDINETSTC-AS | |
| *7 | 9050 | RO | RTD ROMTELECOM S.A | 7 | 6849 | UA | UKRTELNET JSC UKRTELECOM | |
| *8 | 5384 | AE | EMIRATES-INTERNET | *8 | 12322 | FR | PROXAD Free SAS | |
| *9 | 8167 | BR | TELESC | *9 | 18403 | VN | FPT-AS-AP | |
| 10 | 25019 | SA | SAUDINETSTC-AS | 10 | 7738 | BR | T da Bahia S.A. | |
|
* marks ASNs that are in only one of the two top 10 lists Table 1: Most Spam Volume Worldwide, CBL and UTCS, 8 Sep 2010 - 7 Oct 2010. Volume (spam message counts) derived by the IIAR project from custom CBL and UTCS blocklist data . |
||||||||
As Table 1 shows, 6 out of 10 ASNs are the same in this comparison of CBL and PSBL data for all ASNs worldwide for one month from 8 Sep 2010 to 7 Oct 2010. PSBL's spam traps and detection algorithms are different from CBL's, yet there is quite a bit of agreement.
CBL and UTCS
We have another custom spam volume source from the University of Texas at Austin Department of Computer Sciences (UTCS). Comparing it to CBL for this time period produces Table 2 below.| ASN | CC | Description | ASN | CC | Description | |||
| 1 | 9829 | IN | BSNL-NIB | 1 | 7643 | VN | VNPT-AS-VN | |
| *2 | 24560 | IN | AIRTELBROADBAND-AS-AP | 2 | 9829 | IN | BSNL-NIB | |
| *3 | 7738 | BR | T da Bahia S.A. | *3 | 1249 | US | FIVE-COLLEGES-AS | |
| 4 | 7643 | VN | VNPT-AS-VN | 4 | 9050 | RO | RTD ROMTELECOM S.A | |
| *5 | 6849 | UA | UKRTELNET JSC UKRTELECOM | *5 | 14492 | US | DATAPIPE | |
| *6 | 27699 | BR | T DE SAO PAULO SA | *6 | 17055 | US | UTAH | |
| 7 | 9050 | RO | RTD ROMTELECOM S.A | *7 | 21844 | US | THEPLANET-AS | |
| *8 | 5384 | AE | EMIRATES-INTERNET | *8 | 18403 | VN | FPT-AS-AP | |
| *9 | 8167 | BR | TELESC | *9 | 1267 | EU | ASN-INFOSTRADA | |
| 10 | 25019 | SA | SAUDINETSTC-AS | 10 | 25019 | SA | SAUDINETSTC-AS | |
|
Table 2: Most Spam Volume Worldwide, CBL and UTCS, 8 Sep 2010 - 7 Oct 2010. Volume (spam message counts) derived by the IIAR project from custom CBL and UTCS blocklist data. |
Table 2 shows 4 out of 10 ASNs are the same CBL and UTCS for these 30 days. That seems like a small number, but universities get more spam from universities, for example from FIVE-COLLEGES-AS and the University of Utah in this example.
Nonetheless, not only are four ASNs the same between CBL and UTCS, three of them are in the PSBL top 10 as well: VNPT-AS-VN, BSNL-NIB, and SAUDINETSTC-AS. Further, two of them, VNPT-AS-VN and BSNL-NIB, are in the top 4 from all three data sources. This amount of correlation may be one basis for not just rankings but also for certification classes.
ARIN in CBL and PSBL
In previous articles we have alluded to the top 10 spam sources in the ARIN region being recognizable names. Table 3 below shows those names for CBL and PSBL data for this time period.| ASN | CC | Description | ASN | CC | Description | |||
| 1 | 20115 | US | CHARTER-NET-HKY-NC | 1 | 20115 | US | CHARTER-NET-HKY-NC | |
| 2 | 33651 | US | CMCS - Comcast Cable Comm. Inc. | *2 | 40793 | US | ||
| 3 | 33491 | US | COMCAST-33491 | 3 | 33491 | US | COMCAST-33491 | |
| 4 | 6327 | CA | SHAW | 4 | 33651 | US | CMCS - Comcast Cable Comm. Inc. | |
| 5 | 20214 | US | COMCAST-20214 | 5 | 6327 | CA | SHAW | |
| *6 | 10292 | JM | CWJAM ASN-CWJAMAICA | *6 | 36647 | US | YAHOO-GQ1 | |
| 7 | 7132 | US | SBIS-AS - AT&T Internet Services | 7 | 33287 | US | COMCAST-33287 | |
| 8 | 7029 | US | WINDSTREAM | 8 | 7132 | US | SBIS-AS - AT&T Internet Services | |
| 9 | 33287 | US | COMCAST-33287 | 9 | 7029 | US | WINDSTREAM | |
| *10 | 19262 | US | VZGNI-TRANSIT | 10 | 20214 | US | COMCAST-20214 | |
|
Table 3: Most Spam Volume for ARIN in CBL and PSBL, 8 Sep 2010 - 7 Oct 2010. Volume (spam message counts) derived by the IIAR project from custom CBL and PSBL blocklist data. |
Table 3 shows 8 out of 10 ASNs are the same for ARIN between CBL and PSBL in this period. Comcast places 4 of the top 10 ASNs in rankings from both data sources. Charter, Shaw, AT&T, and Windstream also place in both. Verizon only shows up in the top 10 for CBL. With this much agreement in rankings from such disparate data sources, we have some confidence in the results.
These rankings raise all sorts of interesting questions, such as:
- What about rankings by organization, grouping ASNs by owners first?
- What about rankings normalized somehow, for example by size of address space?
Country Comparisons
In another previous RIPE Labs article, Internet Reputation Experiments for Better Security , we proposed rolling out rankings for two example countries, Belgium and the Netherlands, at different times so as to observe changes produced by the rankings themselves. Let's compare those rankings for data from CBL and PSBL. For these tables we're using the same timeframe, October 2010, as in the previous article.BE in CBL and PSBL
The comparison for Belgium is in Table 4 below.| ASN | CC | Description | ASN | CC | Description | |||
| 1 | 5432 | BE | BELGACOM-SKYNET-AS | 1 | 5432 | BE | BELGACOM-SKYNET-AS | |
| 2 | 41451 | BE | TELEDIS-AS | 2 | 41451 | BE | TELEDIS-AS | |
| 3 | 12392 | BE | ASBRUTELE AS Object for Brutele SC | 3 | 12392 | BE | ASBRUTELE AS Object for Brutele SC | |
| 4 | 3304 | BE | SCARLET Scarlet Belgium | 4 | 29587 | BE | SCHEDOM-AS | |
| 5 | 6848 | BE | TELENET-AS | 5 | 12493 | BE | AS12493 be.mobistar Autonomous System | |
| 6 | 12493 | BE | AS12493 be.mobistar Autonomous System | 6 | 6848 | BE | TELENET-AS | |
| 7 | 21491 | BE | UGANDA-TELECOM | 7 | 3304 | BE | SCARLET Scarlet Belgium | |
| 8 | 29587 | BE | SCHEDOM-AS | 8 | 21491 | BE | UGANDA-TELECOM | |
| 9 | 48315 | BE | ALPHANETORKS-AS | 9 | 48315 | BE | ALPHANETORKS-AS | |
| *10 | 25395 | BE | Gateway Communications | *10 | 9208 | BE | WIN WIN Autonomous System | |
|
Table 4: Most Spam Volume for Belgium in CBL and PSBL, October 2010. Volume (spam message counts) derived by the IIAR project from custom CBL and PSBL blocklist data. |
Table 4 shows 9 out of 10 ASNs are the same for BE between CBL and PSBL for October 2010. The top 2 are even in the same order.
NL in CBL and PSBL
The comparison for the Netherlands is in Table 5 below.| ASN | CC | Description | ASN | CC | Description | |||
| 1 | 9143 | NL | ZIGGO Ziggo | 1 | 9143 | NL | ZIGGO Ziggo | |
| 2 | 5615 | NL | TISNL-BACKBONE | 2 | 5615 | NL | TISNL-BACKBONE | |
| 3 | 286 | NL | KPN KPN Internet Backbone | 3 | 286 | NL | KPN KPN Internet Backbone | |
| 4 | 15670 | NL | BBNED-AS | 4 | 13127 | NL | VERSATEL AS for the Trans-European Tele2 IP Transport backbone | |
| 5 | 13127 | NL | VERSATEL AS for the Trans-European Tele2 IP Transport backbone | 5 | 15435 | NL | KABELFOON CAIW Autonomous System | |
| 6 | 12634 | NL | SCARLET Autonomous System for Scarlet Telecom B.V. | 6 | 3265 | NL | XS4ALL-NL XS4ALL | |
| *7 | 28685 | NL | ASN-ROUTIT | 7 | 15670 | NL | BBNED-AS | |
| *8 | 12414 | NL | NL-SOLCON | *8 | 29396 | NL | UNET Unet Network The Netherlands | |
| 9 | 15435 | NL | KABELFOON CAIW Autonomous System | *9 | 20507 | NL | INTERNLNET | |
| 10 | 3265 | NL | XS4ALL-NL XS4ALL | 10 | 12634 | NL | SCARLET Autonomous System for Scarlet Telecom B.V. | |
|
Table 5: Most Spam Volume for the Netherlands in CBL and PSBL, October 2010 Volume (spam message counts) derived by the IIAR project from custom CBL and PSBL blocklist data. |
Table 5 shows 8 out of 10 ASNs are the same for the Netherlands, and the top 3 are in the same order.
RIPE NCC Oct 2010
Finally, let's compare ASNs registered by RIPE NCC for October 2010, as in Table 6.| ASN | CC | Description | ASN | CC | Description | |||
| 1 | 6849 | UA | UKRTELNET JSC UKRTELECOM | 1 | 2856 | GB | BT-UK-AS | |
| 2 | 9050 | RO | RTD ROMTELECOM S.A | 2 | 25019 | SA | SAUDINETSTC-AS | |
| *3 | 5384 | AE | EMIRATES-INTERNET | *3 | 12322 | FR | PROXAD Free SAS | |
| 4 | 25019 | SA | SAUDINETSTC-AS | 4 | 5089 | GB | NTL NTL Group Limited | |
| *5 | 9198 | KZ | KAZTELECOM-AS | 5 | 9050 | RO | RTD ROMTELECOM S.A | |
| 6 | 2856 | GB | BT-UK-AS | *6 | 3209 | DE | VODANET International IP-Backbone of Vodafone | |
| 7 | 5089 | GB | NTL NTL Group Limited | 7 | 6849 | UA | UKRTELNET JSC UKRTELECOM | |
| 8 | 6830 | AT | UPC UPC Broadband | *8 | 3269 | IT | ASN-IBSNAZ | |
| *9 | 6697 | BY | BELPAK-AS | 9 | 6830 | AT | UPC UPC Broadband | |
| *10 | 9116 | IL | GOLDENLINES-ASN | *10 | 3320 | DE | DTAG Deutsche Telekom AG | |
|
Table 6: Most Spam Volume for RIPE NCC in CBL and PSBL, October 2010 Volume (spam message counts) derived by the IIAR project from custom CBL and PSBL blocklist data. |
Table 6 shows 6 ASNs registered by RIPE NCC rank in the top 10 for spam volume by both CBL and PSBL for October 2010.
Summary
We've omitted volume numbers from the tables in the interests of space, but the CBL volume data we get show about 1,000 times as many spam messages as does the PSBL volume data we get, nonetheless the rankings are similar between the two data sources. Most such comparisons we have examined are not exact. LACNIC and AfriNIC tend to show 9 out of 10 the same between CBL and PSBL for a given month. One country, Vietnam, actually shows 10 out of 10 the same for the 8 Sep - 7 Oct 2010 period, with the top 8 in the same order, but this is unusual, and may be due to a relatively small number of Vietnamese ASNs to choose from.For countries like Belgium and the Netherlands, or for the RIPE NCC or ARIN regions, few ASNs cannot be the reason for such close correlations. ASNs that show up at the top in rankings from both sources probably really are sending more spam than other ASNs.
We would be very puzzled if rankings from the CBL and PSBL data did not agree at all. If they agreed 100%, we would also be surprised in the sense that there would be no information added by a second list. Our observations show that they overlap enough to establish confidence in the rankings. They disagree some, which means that there might be some value in looking into multiple lists. At this time we cannot interpret this, but if we watch them over time, we may be able to build some intuition regarding this situation.
As we mentioned in the talk at RIPE 61, Transparency as Incentive for Internet Security: Organizational Layers for Reputation , extreme precision is not the point of the rankings. Reasonable accuracy and confidence is sufficient. This is especially true for building certifications out of rankings over time.
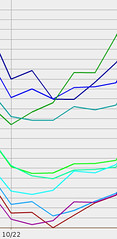
In the other direction, we have daily data, and can show relative changes in addition to total volumes, as in Figure 1 below.
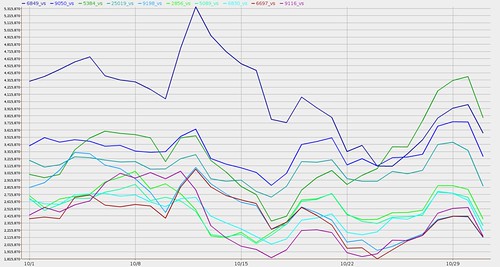
Figure 1: Most Spam Volume from ASNs registered by RIPE NCC, October 2010
Volume (spam message counts) derived by the
IIAR project
from custom CBL blocklist data.
Other rankings may draw on how quickly rankings of a given ASN change, or on how much spam from a given botnet the ASN produces.
Meanwhile, the correlations between these spam volume sources provide sufficient confidence to start prototyping rankings.
Acknowledgments
This material is based upon work supported by the National Science Foundation under Grant No. 0831338. Any opinions, findings, and conclusions or recommendations expressed in this material are those of the author(s) and do not necessarily reflect the views of the National Science Foundation.We also gratefully acknowledge custom data from CBL, PSBL, Fletcher Mattox and the University of Texas Computer Science Department, Quarterman Creations, Gretchen Phillips and GP Enterprise, and especially Team Cymru. None of them are responsible for anything we do, either.
John S. Quarterman for the
IIAR project,
Andrew B. Whinston PI,
Serpil Sayin,
Eshwaran Vijaya Kumar,
Jouni Reinikainen,
Joni Ahlroth,
and other previous personnel.
antispam@quarterman.com
Comments 0
The comments section is closed for articles published more than a year ago. If you'd like to inform us of any issues, please contact us.