
TraceMON is a client-side tool for visualising network topology generated by traceroutes reaching one or more targets in a network. It provides a one-click access to a set of information useful during day to day operations.
Introduction
TraceMON is a client-side tool for monitoring and investigating reachability and performance of one or more targets in a network. It uses traceroutes collected by the RIPE Atlas project or third party repositories for inferring network topology and characteristics of the various network component involved.
TraceMON aggregates data from many data sources, providing a unified and quick point of access to information such as: resource holder contacts, latency, whois, BGP visibility, IP geolocation, IXP detection, reverse DNS lookup and more.
With TraceMON you can see where your traceroutes pass to reach the target and, if they stop somewhere, you can obtain ---with a single click--- information about the resource, including contacts of the owner so you can start sharing a visual snapshot of the traceroute to debug the situation.
Overview
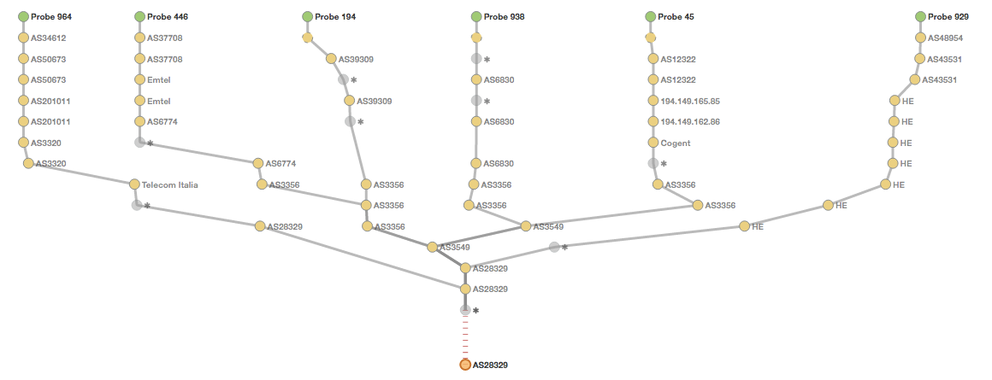
Figure 1 below shows the main view of TraceMON.
The widget is embedded by default on the detail page of each of the traceroute measurements in RIPE Atlas. Any RIPE Atlas user can access it by selecting a traceroute measurement in the measurements listing page and clicking on the TraceMON tab. The tool can also be embedded in any external HTML page or dashboard.

Figure 1: TraceMON interface
The various traceroute results are represented in a graph where each node is a different IP address appearing in the traceroutes. The target is placed at the bottom of the graph with the sources at the top.
TraceMON automatically detects the IXPs traversed (thanks to PeeringDB) and marks them with blue nodes.
All the nodes are labelled automatically, the user can at any time change the labelling options, for example for showing the reverse lookup or the geolocation of the various nodes. TraceMON offers some guesses also about private IPs and wildcards, and in many cases it's able to suggest a possible Autonomous System for them. The graph aggregation and simplification algorithms embedded in the tool are a key feature in producing clean and compact visual output.
As depicted in figure 2 below, by clicking on a node the user can get access to a set of detailed information about the internet resource, including BGP events collected by the RIS service or email addresses of the technical contact. If a source is not able to perform the traceroute, e.g. for DNS resolution failure, a small red error symbol will appear on it. Also in this case the user can click on it to read all the error logs. See probe 558 in figure 3 below.
TraceMON selects a set of probes by default based on a preliminary analysis of the metadata of the measurement, e.g. to increase geographic diversification. Alternatively, a different set of probes can be selected manually.
By clicking on a path is possible to retrieve the real textual traceroute output used for the representation of that specific traceroute.

Main Features
History Reproduction
The selected time frame can be reproduced by pressing the play button at the top. If the traceroutes produced by the same source to reach the target changes over time, the corresponding path in the graph will be animated to resemble the new situation. If a path disappears it means the source is no longer able to perform the traceroute (or at least not in the defined measurement interval). The reproduction speed can be adjusted with the controller at the top.
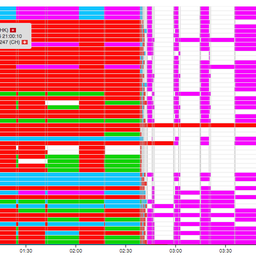
Latency Chart and Time Navigation
At the bottom of the graph there is a latency chart showing latencies and packet loss trends of the various traceroutes in the selected time interval.
This chart is an instance of LatencyMON and can be used as additional timeline for pinpointing the traceroute graph in a specific time instant. By clicking on the chart it is possible to show the exact traceroute situation at that time. This is pretty convenient in case we spot a packet loss situation in the latency chart and we want to analyse the situation in detail. When the target is not reached, a dashed red segment will appear on the graph.
While a particular time frame for the measurement is represented in the latency chart, the additional time bar at the bottom of the widget can be used to navigate throughout the entire measurement's lifetime.
Search and Filter
The search box at the top allows to perform simple searches or elaborated filters. To perform a simple search the user can specify a component of the network to be highlighted as soon as it becomes visible in the graph. The auto suggestion will guide the user.
For more elaborated filtering the user can specify a boolean query where the various items are network components. It is possible to filter by: ASN, IP, IXP, probe ID, outcome (reached, not-reached). E.g. "as3333 OR as6427" for filtering all the traceroute passing trough one of the two Autonomous Systems.
Quick Information Access
One of the most requested features is the possibility to have easy and integrated access to a set of useful information during day to day operations.
By clicking on a node, the popup represented in figure 2 will appear giving access to the following information and functionalities about the host:
- Autonomous System number, holder and registry information;
- Information about whether the resource has been seen as announced at BGP level;
- PeeringDB data and easy access to additional online resources;
- Geolocation of the resource and the possibility to update it by crowdsourcing the information to OpenIPmap directly from TraceMON;
- Easy access to RIPE Database;
- Possibility of viewing the BGP visibility of the selected resource in RIPEstat with BGPlay;
- Single click access to technical contacts and abuse email addresses.

Figure 3: The TraceMON network annotation feature annotates Akamai CDN nodes while the probe 558 reports instead a name resolution error
Network Annotations
In addition to detecting IXPs, TraceMON contains a set of detecting rules providing additional insight about the role of the various network components involved. These annotations will appear as a tooltip as soon as the component is visible for the first time. For example, figure 3 shows how a measurement to a CDN (Akamai) is automatically annotated. In particular the tool is able to recognise that the targets reached are CDN nodes and some of them local caches of an ISP. This feature is experimental and in continuos development in order to increase the set of detection rules.
Upcoming Features
The list of requested features and improvements collected for TraceMON is never ending, but I would like to report here what I consider the most important:
- Autonomous System grouping - for grouping the hosts in the graph based on their ASN;
- Real-time monitoring - for updating the graph by using the live feed from the RIPE Atlas streaming;
- Additional aggregation - for grouping nodes based on user defined specifications;
- Alias resolution - to detect multiple interfaces of the same node;
- Path coloring annotation - to allow a more flexible path coloring, for example to distinguish which part of the graph is local network and which is the network of the target;
- Anomalies detection - integration of TraceMON with auto detection projects such as Pinpointing Delay and Forwarding Anomalies Using Large-Scale Traceroute Measurements (Fontugne, Aben, Pelsser, Bush).
- Auto filtering - to automatically highlight the traceroute variations that are considered "interesting" based on historic behaviours.
Source Code and Documentation
You can get the source code - and contribute - on GitHub.
If you just want to use the tool, you don't need the source code. TraceMON can be embedded in any HTML page.
Please refer to the TraceMON documentation for more details.
Feedback
We always want to hear what you think about the tools and services we offer. And we would especially like to hear about your own use cases for TraceMON.
Here's how to get in touch:
- If you want to report a bug or problem: atlas [at] ripe [dot] net
- Please subscribe to the RIPE Atlas mailing list for discussions with active users and RIPE Atlas developers: ripe-atlas [at] ripe [dot] net
- For direct feedback: Contact Massimo Candela at mcandela [at] ripe [dot] net
Comments 8
The comments section is closed for articles published more than a year ago. If you'd like to inform us of any issues, please contact us.
Massimo Candela •
I received some questions about the exact location of the tool. This is now clarified in the text (above Figure 1). If you have any more questions, please let us know.
Daniel Karrenberg •
Suggestions: a) add an option to limit to h hops from the target and then show paths from all probes providing data during the interval b) use 'network names' as a label option c) use AS 'names' as a label option d) use a colour scale (better visual resolution than greyscale) for the number of paths along an edge e) add an option to only show endgs used by at least p % of all probes providing data during the interval f) make h=4 and p=25 the default view For examples of all that see https://labs.ripe.net/Members/dfk/map-a-ripe-atlas-anchor Daniel
Massimo Candela •
Hi Daniel, Thank you for your feedback! I have already something for the hop limit, but I have to improve the visualisation because I would like to preserve the probes in the graph (so I have to show that there are hops missing between the probe and the "first" hop). I saved the other suggestions in my ticket queue. Ciao, Massimo
Daniel Karrenberg •
They are suggestions, so do not take them as instructions! Especially the defaults I suggested should be subject to discussion and community feedback. As to keeping the probes visible: I do not think that this is what the typical user wants when they are interested in the topology close to the *target*. In any case what I was interested in when I used traceroutes like that was a simple representation of the topology close to the target, never mind how the packets got close. Daniel
Jams •
How one can use TraceMon on windows.im not seeing any exe file.
Massimo Candela •
TraceMON is a web application you can run in your browser without any third-party plug-in. The operative system doesn't matter. It supports Chrome, Firefox, Safari, Edge. It doesn't support Internet Explorer. For now, the only traceroute datasource is RIPE Atlas (https://atlas.ripe.net/) You can create a measurement on RIPE Atlas and by clicking on the tab "TraceMON" you will see the results.
Development Labs Nic At •
Thanks, that's a great widget. I am looking forward to the Autonomous System grouping feature. I think this can help us a lot for BGP optimizations of our anycast DNS.
Vasanth •
Can i use this monitoring tool to analyze traffic captured through TCPdump from F5 LTM devices. If so how i can download this tool to use. Thanks and regards, Vasanth