Network measurements are an important tool in understanding the Internet. Due to the expanse of the IPv6 address space, exhaustive scans in IPv4 are not possible for IPv6. The best practice when conducting IPv6 measurements is to use so called IPv6 hitlists.
In this article, we analyse IPv6 hitlists to further understand their use in IPv6 measurements and explore techniques to tailor hitlists to your own measurement needs.
IPv6 hitlists
Nowadays, most Internet-wide measurement studies in IPv4 conduct brute-force measurements, i.e. probing every possible address of the about 2 billion routed addresses.
Since the address space in IPv6 is orders of magnitude larger than in IPv4 (3.4 * 1038 compared to 4.3 * 109), we can not adopt the brute-force approach in IPv6 measurements. Therefore, IPv6 measurements rely on lists of target addresses, so called IPv6 hitlists.
Assembling a hitlist
We can use many different sources to extract IPv6 addresses for a hitlist. One way to categorise sources is by their availability:
- Public sources: these are publicly available and can be downloaded or generated by everyone, e.g. IPv6 addresses from resolving the Alexa Top 1M list.
- Private sources: these are only available to a specific group of people, e.g. addresses extracted from passive traffic traces of a university network.
In order to make our work reproducible and to make our IPv6 hitlist publicly available, we focus on addresses from public sources.
In our study we use the following sources:
- Domain lists: zonefiles, toplists, blacklists
- Rapid7 ANY DNS
- Domains extracted from Certificate Transparency (CT)
- Bitcoin node addresses
- RIPE Atlas: traceroutes, ipmap
- Traceroute addresses by running scamper
- Crowdsourcing addresses (which we analyse separately, due to their privacy-sensitive nature)
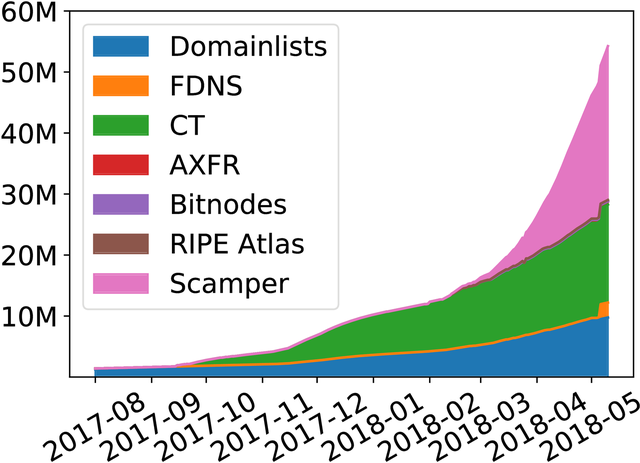
Figure 1: IPv6 hitlist sources runup
Hitlist distribution
As we can see in Figure 1 the different sources provide a vastly different number of IPv6 addresses over time. Most addresses are contributed by domain lists, Certificate Transparency, and tracerouting.
Next, we investigate how diverse addresses from specific sources are, specifically in terms of covered Autonomous Systems (ASes) and BGP prefixes.
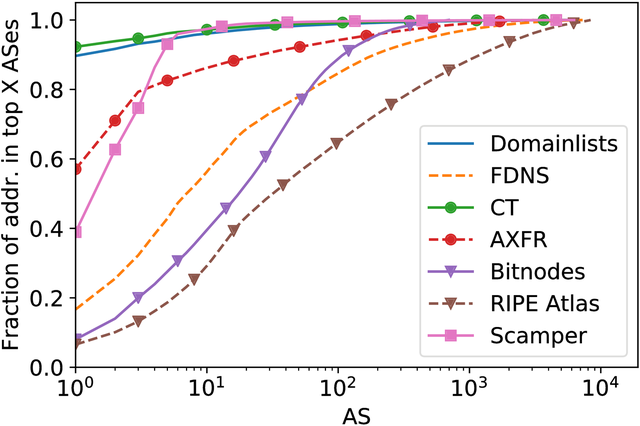
Figure 2: IPv6 hitlist AS distribution
As shown in Figure 2, the AS distribution for the various sources is quite different: some sources are more unbalanced (e.g. CT, domain lists) compared to others, which are more balanced (e.g. RIPE Atlas). Keep in mind, however, that comparing ASes with each other is only indicative, as different types of ASes announce very differing numbers of IPv6 prefixes and therefore addresses.

Figure 3: BGP prefix coverage
To get a better understanding of our hitlist's coverage of the IPv6 Internet as a whole, we use zesplot in Figure 3. Zesplot is a plotting tool, which displays prefixes in a space-filling way (but, unlike a Hilbert curve which shows the complete IPv4 address space, zesplot does not plot the entire IPv6 address space). Prefixes are plotted as rectangles in lines and columns, starting in the top-left corner, sorted by {prefix size, ASN}. More-specific prefixes are plotted in their less-specific parent rectangles.
In Figure 3 we find a bright red /19 prefix in the top left corner, the centre is filled mostly by /32 prefixes, and the bottom right is comprised of very specific prefixes (e.g. /127). An interactive version of this plot enables better exploration of the data, showing additional information like AS numbers and number of addresses per prefix.
Generally, our hitlist covers half of all announced IPv6 prefixes (25.5k of 51.2k). Most prefixes are sparsely covered, with a few exceptions where we see many addresses in prefixes, which are covered in red or yellow.
Using this analysis we can assess the bias contained in IPv6 hitlists and take action (e.g. by sampling from over-represented hitlists).
IPv6 addressing schemes
To better understand the address population in our hitlist, we analyse the used addressing schemes. We do this using a technique called entropy clustering:
- We group addresses according to their prefix.
- We calculate the entropy of each nybble (i.e. hex character) for all prefixes.
- We combine the entropy of the nybbles by aggregating them into an entropy fingerprint for each prefix.
- We cluster prefixes based on their entropy fingerprint using k-means clustering.
Intuitively, the entropy fingerprint describes addressing patterns within a prefix. It highlights parts of the addresses which have a high variation compared to stable parts. Consequently, the clustering based on entropy fingerprints groups prefixes with similar addressing patterns.
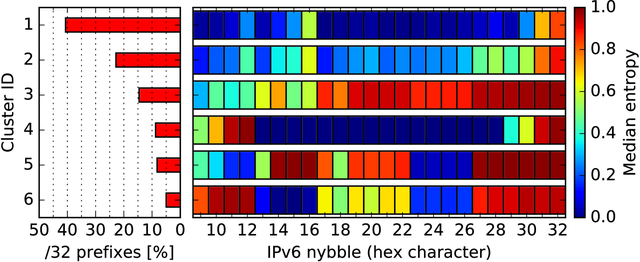
Figure 4: Entropy clustering based based on /32 prefixes
We apply the entropy clustering based on /32 prefixes and show the results in Figure 4. Using the k-means clustering we can group all prefixes into just six different addressing schemes. We find well-known addressing schemes such as privacy extensions (cluster 3), EUI-64 mapped MAC addresses (clusters 5 and 6), and using the network and interface part as simple counters (clusters 1, 2, and 4).
Using the entropy clustering analysis we can focus on prefixes with certain addressing schemes (e.g. no privacy extensions) in measurement studies.
Responsiveness over time
We probe all addresses in our hitlist over a period of several months using five popular protocols: ICMPv6, HTTP, HTTPS, QUIC, and DNS. To assess responsiveness over time we analyse a two-week period and evaluate how many of the initial addresses are reachable each day.
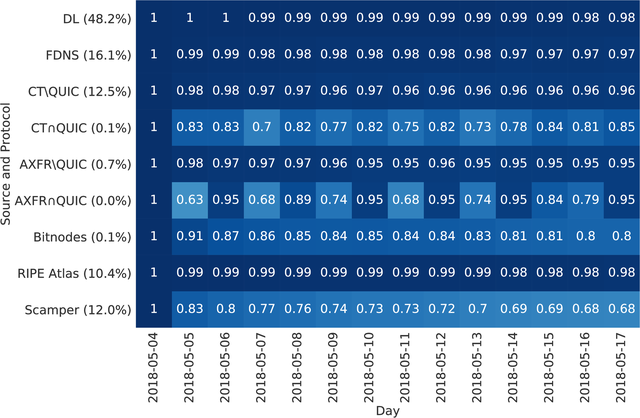
Figure 5: Responsiveness over a two-week period based on source and protocol.
In Figure 5 we show responsiveness per source, and for some cases also based on the probed service. For domain lists, FDNS, and RIPE Atlas sources the response rate is very stable. Other sources such as Bitnodes and Scamper, include a higher portion of CPE devices and lose between 20% to 32% of responsive addresses after two weeks. Interestingly, for CT and AXFR the QUIC protocol varies daily in responsiveness. This phenomenon is due to two networks: Akamai and HDNet. These networks seem to be testing their QUIC deployment by enabling and disabling or throttling QUIC endpoints every day.
Analysing responsiveness over time shows that certain sources are less stable. As a result, measurements that focus on sources with CPE devices are prone to more churn, which could influence measurement results.
IPv6 hitlist service
To encourage IPv6 measurement research we publish our daily hitlist and a list of aliased prefixes for fellow researchers at:
We appreciate any feedback about our work and the provided IPv6 hitlist!
For more details about our methodology, measurements, and additional evaluations such as aliased prefix detection, client IPv6 address measurements using crowdsourcing, and learning new addresses, we refer to our publication:
- Oliver Gasser, Quirin Scheitle, Pawel Foremski, Qasim Lone, Maciej Korczynski, Stephen D. Strowes, Luuk Hendriks, Georg Carle, Clusters in the Expanse: Understanding and Unbiasing IPv6 Hitlists, ACM Internet Measurement Conference 2018 (If you refer to this work, please cite).
Summary
- We assemble an IPv6 hitlist from multiple sources and analyse its characteristics.
- We conduct continuous measurements to evaluate responsiveness over time. We find that sources with a higher percentage of client devices exhibit a stronger decrease.
- We provide an IPv6 hitlist service where researchers can download lists of IPv6 addresses and aliased prefixes at ipv6hitlist.github.io.


Comments 0
The comments section is closed for articles published more than a year ago. If you'd like to inform us of any issues, please contact us.