As part of the Internet health hackathon, we studied RIPE Atlas delay signals before and during the COVID-19 pandemic. Here's what we found.
With over 10,000 vantage points worldwide that sense network delays across the world, RIPE Atlas is an interesting tool for monitoring the health of the Internet during COVID-19.
RIPE Atlas provides a lot of raw RTTs using pings and traceroutes, which get aggregated into higher-level signals as part of the Internet Health Report, one of the projects supported by the RIPE NCC Community Project Fund.
For the Internet Health Hackathon, we used RIPE Atlas to develop an interface that provides information about network delays.
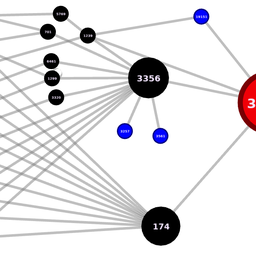
This interface shows the delays between major eyeball networks in a specific country and a number of other networks. For Europe, the default is set to show delay to the Google network (AS15169), two large IXPs (AMS-IX and DE-CIX), and the other network(s) these major eyeball networks are most dependent on according to the AS hegemony metric.
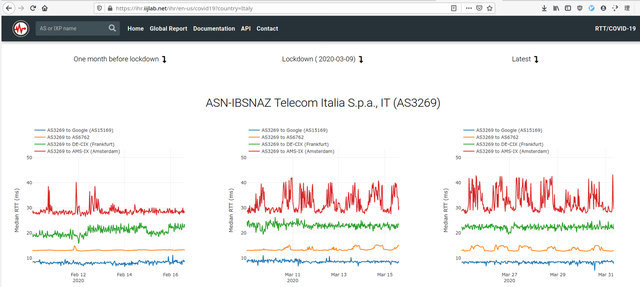
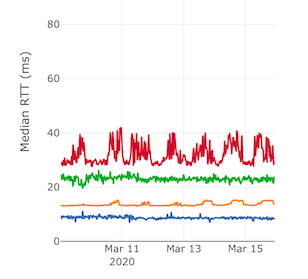
For example, you can see below an overview of this data for Italy. The interface shows three columns for each of those major eyeball networks in a country. The first column shows delays for one month before the lockdown, the middle column shows delays for the period just after lockdown, and the last column shows the latest data available. What you can see in this case is that the delay towards AMS-IX started to show diurnal patterns (which could point at periodic congestion) around the time Italy imposed a national quarantine.

Figure 1: Network delay for networks in Italy
Our conclusion is that overall the Internet is doing well, and is keeping up with the increasing amounts of traffic that are reported elsewhere (thanks Christian Koch for collecting these). We do see interesting changes, and some congestion, which is normal and to be expected in a situation like this.
The interface currently only shows countries where we could find a lockdown start date by referring to this Wikipedia article. If you want to help out, you can either improve the script that pulls this data (Pull requests welcome!) and/or update the Wikipedia page.
We are also looking at the latencies for the hops close to RIPE Atlas probes to see if we can observe any interesting patterns and trends in these delays. We intend to write that up on RIPE Labs soon.
Let us know what you think about this interface and if there is other interesting data that might be hidden in RIPE Atlas that you would want us to look at. You can share your insights with us in the comments below.
Stay tuned! Stay safe!


Comments 6
The comments section is closed for articles published more than a year ago. If you'd like to inform us of any issues, please contact us.
Maxime Mouchet •
Hi Emile, Romain, Thanks for this article, it's nice to see a discussion about the delay, and not only IXPs traffic levels! > We do see interesting changes, and some congestion, which is normal and to be expected in a situation like this. > Actuellement, les liens qui souffrent le plus sont **sans doute** les liens entre les FAI (Fournisseurs d’Accès Internet) et les services de vidéo comme Netflix. (S. Bortzmeyer, https://framablog.org/2020/03/21/linternet-pendant-le-confinement/) I agree that congestion is to be expected, but I would like to see a more in-depth analysis :) Where is this congestion happening, and how different is this from before (in terms of periodicity, duration, etc.) ... From my residential ISP I observe delay increases never seen before for some services. Maxime
Emile Aben •
Thanks for your comment Maxime. I would love to see more analysis too, and the tool allows people to do this. Take for instance this thread on Twitter where Jason Livingood analyses the signals for the US: https://twitter.com/jlivingood/status/1245142990336688130 If others have analysis for specific countries they want to share it would be great to have them collected, for instance as comments to this RIPE Labs post!
Matt •
How do we get additional eyeball networks added for a country? The dashboard is great! Lots of people asking for this kind of data, so it really shows off what kind be done with the RIPE Atlas data.
Romain Fontugne •
Hi Matt, The RTT/COVID dashboard only shows the top eyeball networks in a country, but if you are interested in a particular network you can type its name or ASN in the top left search field. It will bring you to page with all the metrics we have for that network. If really you want to add more networks to the dashboard, then I could change it :)
Juraj •
Hi any chance you can add Slovakia to the list of countries ? I think it already included in the Wikipedia article with March 16th as a start date for lock down. Many thanks
Romain Fontugne •
Hi Juraj, thanks, I added Slovakia: https://ihr.iijlab.net/ihr/en-us/covid19?country=Slovakia