
Detecting network disruptions is a recurring problem. Clearly locating performance degradation is an important step in debugging and subsequently fixing connectivity issues.
We propose a set of complementary methods to detect network disruptions from traceroute measurements. A novel method of detecting changes in delays is used to identify congested links, and a packet forwarding model is employed to predict traffic paths and to identify faulty routers in case of packet loss. We apply our methodology to three cases demonstrating that the proposed methods detect real disruptions and provide valuable insights, as well as surprising findings, on the location and impact of identified events.
Dataset
With its impressive spread across the globe and almost 10,000 probes constantly connected, RIPE Atlas is a great candidate for such a study. We have analysed the built-in and anchoring measurements results from 1 May to 31 December 2015. This corresponds to a total of 2.8 billion IPv4 traceroutes (1.2 billion IPv6 traceroutes) from a total of 11,538 IPv4 probes (4,307 IPv6 probes) connected within the eight studied months.
As our study relies solely on traceroute results, the scope and terminology of this work are constrained to the IP layer. That means, a link refers to a pair of IP addresses rather than a physical cable.
Challenges
Detecting significant delay changes and increase in packet loss from traceroute is subject to the three following challenges:
- Traffic asymmetry: We lack information on the return path. In addition, separating the delay experienced on the forward and return path is an open issue.
- RTT variability: Even in the absence of events, RTTs are noisy. How do we separate noise from the main signal?
- Packet loss: It is easy to quantify packet loss. The challenge resides in locating the routers that are dropping packets.
Detecting delay changes
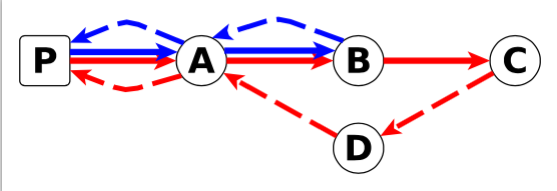
To detect delay changes we rely on the notion of differential RTTs. Let C be the downstream router of B (see Figure 1). It consists of the subtraction of the RTTs to C and B.

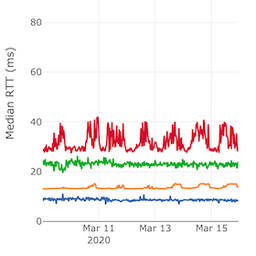
Figure 1: Round-trip time to router B (blue) and C (red) and Figure 2: Difference of the round-trips to C and B
We use the Central Limit Theorem to detect anomalies. It says that if we have enough RTT samples, the mean of RTTs follows a uniform distribution. We monitor delays on links crossed by traceroutes from a large number of source probes to meet this requirement. As events affecting B -> A and B -> C -> D -> A are independent, this technique enables us to filter out uncertainties from return paths.
Because RTTs are noisy, we rely on the median instead of the mean. Previous work [1] says that this is a valid approach.
Now we have the tools to compute a reference differential RTT with its confidence interval for each link. This is the value that should be expected under normal operations. We raise alarms when the current observation and confidence interval do not overlap with the expectation interval.
Detecting forwarding anomalies
To locate packet losses and changes in paths, we build a forwarding model from traceroutes. For 10 observations of IP A, 100 for IP B and 5 packet losses after hop R, we build the annotated graph of Figure 3. We do not rely on a single observation point to build this model. Instead we annotate the edges by using exponential smoothing. This enables us to reduce sensitivity to outlier observations.

Figure 3: Usual forwarding pattern and Figure 4: Anomalous pattern
In normal conditions we expect a router to forward packets as they did in past observations. In other words, we expect the current observation (F) and the reference (F’) to be linearly correlated. This linear dependence is easily measurable as the Pearson product-moment correlation coefficient of F and F’. If the correlation coefficient is below -0.2, we consider we have a forwarding anomaly. It means that the proportions of packets sent to next hops are different from those observed in past data (see Figure 4). Now, we devise a metric to identify hops that are responsible for forwarding pattern changes. We call this the responsibility metric in [3].
Alarm aggregation
We group alarms per AS. For the delay, the severity of the alarm is the sum of the deviations from the references for each link in the AS. The severity of the alarm for forwarding anomalies is the sum of the responsibility scores for each of the next-hops in the AS. We then apply an outlier detection mechanism to identify peaks [1].
The advantage of this per AS grouping is to enable us to easily pinpoint ASes affected by an event. If traffic moves from one path to another within an AS we will however not be able to detect the change.
Use cases
Our first case-study shows the impact of a large distributed denial-of-service (DDoS) attack on network infrastructure. The first attack was on 30 November 2015 from 06:50 to 09:30 UTC, the second on 1 December 2015 from 05:10 until 06:10 UTC. Because the source IP addresses for both attacks were spoofed, it is unclear from reports [2] where the traffic originated. Our technique is able to detect IP links experiencing changes in delay. We detect congestion to the K-root instances in St. Petersburg, Kansas City and Hamburg while nothing noticeable happens upstream of the instance in Poznan. This may guide us in locating the sources of the attacks for operators to set appropriate filters.
The second case study exposes a different type of network disruption; here the detected anomalies are caused by abnormal traffic rerouting. On 12 June 2015, 08:43 UTC, Telekom Malaysia (AS4788) unintentionally sent BGP announcements for numerous IP prefixes to its provider Level(3) Global Crossing (AS3549) which accepted them. Figure 5 and 6 show that while the event occurred in Malaysia, we observed congestion in London,10,200 km away. The label on each edge in Figure 6 is the absolute difference between the observed median differential RTT and the median of the normal reference. The link in Figure 5 is marked by a delay change of +229ms. Similar observations are made for the two Level(3) ASs and numerous cities mainly in the U.S. and Europe.

Figure 5: London-London link – delay change reported on 12 June 2015 at 9:00 and 10:00 UTC

Figure 6: Congestion at Level(3) Global Crossing (AS3549) in London on 12 June 2015. Each node represents an IPv4 address, edges represent delay changes for an IP pair. Red nodes depict IP addresses involved in forwarding anomalies
Some events are only detectable through our forwarding anomalies detector. This is the case of the AMS-IX outage of 13 May 2015 around 10:20 UTC. The packet forwarding model allows us to precisely determine peers that could not exchange traffic during the outage. In total 770 IP pairs related to the AMS- IX peering LAN became unresponsive. The proposed method to learn packet forwarding patterns and systematically identify unresponsive IP addresses greatly eases the understanding of such an outage.
More details on these use cases can be found in [3].
Conclusion
The RIPE Atlas platform gathers a large amount of traceroutes. We proposed a set of statistical methods to mine gold of out this data. We show that we are able to accurately pinpoint delay changes and packet loss.
We make our tools and results publicly available (and here is a prototype sketch) in order to share our findings and contribute to a better understanding of Internet reliability.
Bibliography
[1] R. R. Wilcox. Fundamentals of Modern Statistical Methods: Substantially Improving Power and Accuracy . Springer Science & Business Media, 2010.
[2] M. Weinberg and D. Wessels. Review and analysis of attack traffic against A-root and J-root on November 30 and December 1 , 2015. OARC 24, April 2016.
[3] R. Fontugne, E. Aben, C. Pelsser and R. Bush. Pinpointing Delay and Forwarding Anomalies Using Large-Scale Traceroute Measurements. http://arxiv.org/abs/1605.04784 . May 2016.


Comments 0
The comments section is closed for articles published more than a year ago. If you'd like to inform us of any issues, please contact us.