
In February this year, we opened up applications to host RIPE Atlas software probes. After spending a few months diligently measuring the Internet, how are they doing?
RIPE Atlas software probes have been generally available since 12 February this year. That's enough time for people to have installed a large number of them, and possibly also for many of them to have dropped offline. In this article, we want to look at where new probes are being installed, whether they're staying online, and whether the measurement data we receive from them is notably different to hardware probes.
In this article, I'm generally considering the time period between 12 February, and 15 September. In that time, 790 new software probes have connected to the service, in addition to 909 hardware probes, 105 virtual anchors, and 19 baremetal anchors. Here, I'm going to cover where the probes have been installed (geographically), where they've been installed (topologically), how long they've been up, and how aspects of their measurement data look.
Geographic Location
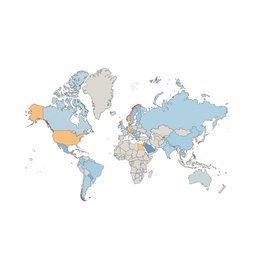
Geographic diversity is an important part of what makes the RIPE Atlas platform useful. Software probes have been deployed in various countries in the last few months; Figure 1 shows us the distribution of countries, ordered by the number of connected or recently-disconnected software probes. Probes that are considered abandoned aren't included here.

Figure 1: Country-level locations for new probes. Countries marked with an asterisk (*) have more new software than new hardware probes.
We have 60 countries with new software probes in total; "None" refers to probes that don't have a country code in their metadata. Country codes marked above with an asterisk have a greater number of new software probes instantiated than other types on 15 September.
So we have some clear countries with many software probes, just as we do hardware probes: Germany, the USA, and Russia already have significant probe populations. But are we also in new or under-represented locations? Definitely yes. Some examples include:
- 7 software probes in Vietnam, in addition to 5 hardware probes and 1 virtual anchor.
- 5 software probes in Uzbekistan, in addition to 4 hardware probes.
- 6 software probes in Benin, in addition to 9 hardware probes (1 of which was installed during this study).
- 3 software probes in Bahrain, in addition to 5 hardware probes (1 installed during this study)
- 1 software probe in Namibia, in addition to 2 hardware probes.
- and for part of the study, 1 software probe in Turkmenistan where previously we had no coverage at all.
There are also cases where we had coverage in the past but the software probe installations were notable, such as 26 software probes in China, where we previously only have 31 hardware probes in total.
These are simply examples of where we are now. There are of course many countries with little or no coverage, and software probes ought to make coverage in those locations much easier. If you'd like to see how your own country is doing in terms of general coverage, take a look here and consider getting involved!
Network Location
As of 15 September, we have software probes hosted within 389 IPv4 ASNs, and 147 IPv6 ASNs. But are software probes being hosted inside new networks? 163 of the IPv4 ASNs and 65 of the IPv6 ASNs have no other active probes or anchors at all. That feels like progress!
There is of course a long tail of networks, but Figure 2 indicates the most popular network locations for software probes.

Figure 2: Network location of new probes: IPv4 (left) and IPv6 (right). ASNs marked with an asterisk (*) have more new software probes than new hardware probes.
One thing that stands out immediately in this figure is that there are networks here with reasonable numbers of software probes that didn't install any hardware probes during this timeframe. That's great news: one of the main advantages of a software probe is to get around the constraint of shipping, hosting, and running a physical device.
Additionally, a non-trivial number of probes on the IPv6 network are still connecting through what are likely to be Hurricane Electric tunnels; in an ideal world, we'd love to see more probes connecting over native IPv6!
Uptime
Just as it can be simple to set up a software probe, it can be simple to remove the probe, or the machine that's hosting the probe (virtual or otherwise). Our preference for RIPE Atlas is that probes form somewhat stable vantage points. So are software probes stable?
For reference, considering probes which first connected between 12 February and 15 September, 620 software probes were connected, 133 were recently disconnected (possibly transient disconnections), and 37 were considered abandoned. Compare to 727 connected hardware probes (including anchors), 116 recently disconnected, and 66 abandoned, we have a slightly lower abandonment rate for software probes.
Of course we rely on a machine of some kind to run the software probe, and those machines could represent a variety of environments: home networks, virtual machines in datacenters, cloud environments, and so on. We have little control over that, but many environments themselves are not designed for long-term stability, and this may influence our uptimes.
Figure 3 helps us understand the question: does a software probe have lower uptimes than other probe types?

Figure 3: Probe uptimes. Potential uptime of X% or less was achieved by Y% of probes. Potential uptime is the time from when a probe was first instantiated, until September 15th.
This plot is cumulative. In the extreme cases, a line that hugs the bottom right corner of the plot then peaks to 100% implies probes of that type have close to 100% uptime. On the other hand, a line that hugs the upper left corner implies probes of that type tend to have close to 0% uptime. Lines further up the plot imply more probes with the uptimes enumerated on the x-axis.
Take 50% uptime as an example. An uptime somewhere in the range of 0% -- 50% of the potential uptime for a probe was achieved by 10% of the software probes, and 7% of hardware probes. Similarly, an uptime in the range 0% -- 90% was achieved by 22% of both probe types. Less than 10% of either anchor type has an uptime so low. Indeed, almost all anchors have uptimes higher than 99%.
Software and hardware probes are pretty similar in their uptime behaviour, with only one distinct difference: the software probes exhibit a tendency toward lower uptimes in the middle of the plot, seen in about 15% of those probes. It's tempting to theorise on that 15%. Maybe Software probes are easier to simply build and test, or hosts are rebooted and the probe isn't brought back up, or a virtual host is destroyed, or simply that without a physical reminder with blinking lights their owners simply forget about them.
The top 78% of probes however, both hardware and software, share similar high uptimes of 90% or more in this period. So although it does appear that software probes are slightly less "sticky" in some cases, most software probes stay online just as long as their hardware counterparts. That's good news!
Comparing Measurement Results
Locating probes in the same network
Some RIPE Atlas users have been diligently running software and hardware probes from the same network, myself included. In order to perform an apples-to-apples comparison of RIPE Atlas probes, this is useful: probes that appear to be located in the same network are great for comparison relative to shared targets. Probes generally have some shared targets, at minimum because they typically all participate in built-in measurements.
To locate candidate probes, it's useful to start with very few assumptions: probe data doesn't reveal who probe owners are, and a probe's geo information says nothing about its network connectivity. ASNs can cover vast geographic areas, so that alone is not a useful metric either. IPv6 addresses, however, start to get us closer to a candidate set: if we locate probes in the same /64 then not only are they topologically in the same place (in terms of network addressing), it's reasonably likely that they're also geographically in a similar location. Of course, there are many variables on how that network is managed on the probe owner's premises, but this is a good starting point which assumes little else.
To complexify this over a long time period, probes may be active or inactive at different times, may have changed network, etc. So, to identify pairs, I'm looking for probes that were assigned IP addresses inside the same /64 on the same day, where at least one probe is a hardware probe and one is a software probe. Network addresses change, so probes are counted as a pair if the network matches on any given day; it doesn't need to be constant throughout the time period. Further, I'm throwing away probes with addresses drawn from Hurricane Electric address space: tunneled probes are less useful when we want to compare the probes themselves. Finally, I'm only considering probes that were simultaneously active on 100 days or more, to give a good candidate set of days to compare.
This ultimately gives us 18 pairs of probes active at the same time, a reasonable basis for comparison. Figure 4 shows us when these probes were active.

Figure 4: Pairs of hardware and software probes located within the same /64.
The probes themselves are:
| No. days | Pair ID | ASN | HW probe(s) | SW probe(s) | |
|---|---|---|---|---|---|
| 216 | 2 | 3130 | 4981 | 1000004 | |
| 216 | 3 | 3130 | 4981 | 1000006 | |
| 206 | 18 | 22773 | 55178 | 1000153 | |
| 205 | 12 | 43708 | 15861 | 1000069 | |
| 203 | 4 | 14061 | 6362 | 1000246 | Hosted in DigitalOcean |
| 171 | 15 | 8708 | 30983 | 1000223 | No comparable results? |
| 159 | 9 | 197451 | 13105 | 1000007 | |
| 146 | 10 | 6830 | 14277 | 1000236 | |
| 132 | 1 | 35518 | 2827 | 1000504 | |
| 132 | 17 | 31246 | 32006 | 1000362 | No comparable results? |
| 126 | 13 | 2516 | 29080 | 1000164 | |
| 122 | 5 | 199524 | 6606 | 1000535 | |
| 117 | 16 | 16276 | 31548 | 1000163 | Hosted in OVH |
| 111 | 14 | 6830 | 30222 | 1000340 | |
| 107 | 6 | 61157 | 6802 | 1000543 | |
| 102 | 7 | 6659 | 6806 | 1000544 | |
| 102 | 8 | 6659 | 6807 | 1000545 | |
| 102 | 11 | 55391 | 14360 | 1000179 |
You can find the backing code for this in this notebook. Two of the probes above, 1000223 and 1000362, were connected and marked as active, but they generated no comparable measurement results so I don't include them in the remaining analysis.
Comparing results from those probe pairs
A substantial part of what users of RIPE Atlas want from the platform is probe and network diversity, but that means little if the measurements are not reliable. In order to get a sense of how reliable the measurement data from these probes is, I wanted to look at actual measurement results, but only where the probes were measuring the same targets.
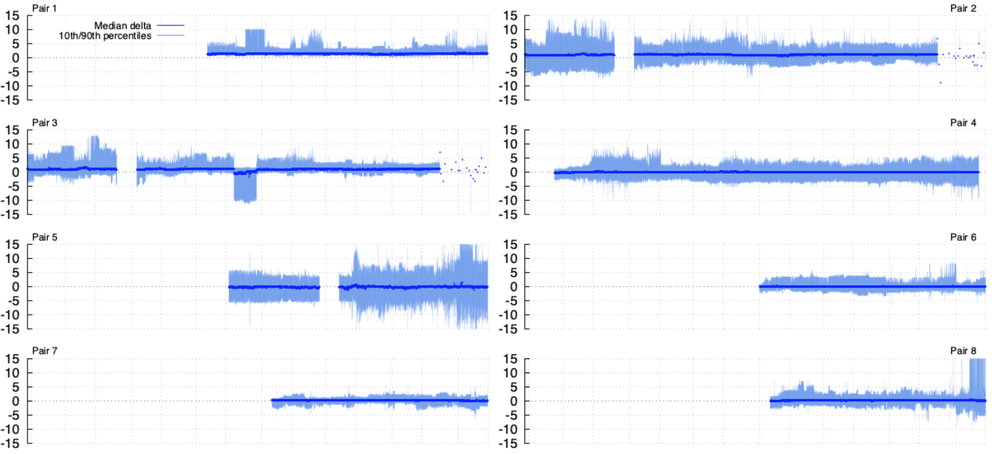
In Figure 5, I'm showing each probe pair separately. For each pair, I'm collecting all ping measurement RTTs per hour and, when there is a shared target, I'm calculating the difference between the value measured by the hardware probe and the software probe. I'm agnostic to which targets. If both probes in a pair measure any target in the same hour, it's counted. Gathering the differences for all targets per hour, in the figure I'm showing the 10th percentile, median, and 90th percentile differences here.

Figure 5: Measured differences in latencies to all shared targets from pairs of probes during the study. 0ms means the two probes measure the same RTT; deviations around 0ms are expected for probes located in the same network. Error bars in light blue show the 10th and 90th percentiles below and above the median, in dark blue.
The key thing to look for above is this: if the probes are truly in the same place in a network -- attaching as close to the same point on the network as possible -- and the hosts aren't ridiculously overloaded, then the measured differences should form a distribution around zero.
That's evident on almost all probe pairs: they have stable median differences of 0ms when they're both active. Pair 16's median is also stable, but with a 10ms difference between the two probes they're clearly in different physical locations. These probes are hosted in OVH, a hosting service that operates in multiple locations, so this is unsurprising.
One thing we cannot see is the workload on the hosts that software probes are also running. Although the RIPE Atlas workload is not high, other workloads on the same machine might incur queuing or processing latency. It's conjecture, but pairs 1 and 3 show signs of abrupt changes in their outlier RTTs, and this may be related to the workload on the host (or, it could be any number of other things). The median differences remain stable in these cases, but it may be something to bear in mind for specific types of measurement campaigns.
Loss Rates
Probes operating in different environments are likely to experience differing loss characteristics. It is tricky to generalise the loss patterns of a RIPE Atlas probe against loss patterns that may be observed on higher workloads. But it may be possible to observe loss patterns on heavily loaded machines that software probes are running on.
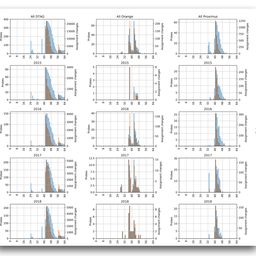
I've taken the packet loss for the above pairs of probes, again using probe pairs with shared targets, but this time per day to reduce the number of points to compare. Figure 6 shows us these loss patterns for our probe pairs.

Figure 6: Packet loss rates to shared targets from pairs of probes during the study.
Some background on the computation of the above can be found in this notebook.
In total, across the whole dataset, we're counting around 38.9 billion packets sent by all the probes above to shared targets in this timeframe, with around 19.7 million that didn't receive a response. The difference between hardware and software probes is slight: 10.3 million packets sent by hardware probes went without a response, while 9.4 million packets from software probes went without a response. These numbers are obviously highly dependent on the network and the hardware a probe is running on, but it's useful to see that these probes are in well-connected, reliable locations, and that the systems our software probes are running on here appear highly reliable.
Conclusion
Based on the above, the growth of software probes and their stability seems pretty good: generally comparable to our hardware probes. There is a slight tendency for some software probes to drop offline sooner. The shared activity days of the probe pairs suggest probes go offline and stay offline, rather than show intermittent connectivity. When connected, the probes generate results highly comparable to the hardware probes, which is great.
If you'd like to add more to the network, especially if you are in an area or a network under-served by RIPE Atlas, (check out your network coverage here), you can read more about applying to host a software probe here, or apply for a hardware probe here.
If you'd like to get even more involved with this project, on 25 November we're organising a software probe deployathon. Please consider taking part!

Comments 0
The comments section is closed for articles published more than a year ago. If you'd like to inform us of any issues, please contact us.