

We've been using Google's BigQuery platform for ongoing operational tasks and research questions, and we've got a little more experience under our belts. We're improving the ways we expose public data on the platform.
We've been publishing RIPE Atlas measurement results publicly on Google BigQuery since late last year. In the spirit of iterating toward better things, we're making a few changes, mostly by adding new views to existing data for now. Here's what's changing.
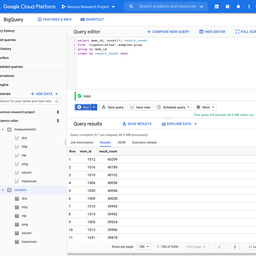
New Datasets
To be clear on BigQuery terminology: datasets contain tables or views over tables.
Under the public ripencc-atlas project, we're now exposing three new datasets:

These datasets contain the following:
- probes: contains two views: probes and probes_archive. Measurement data alone only goes so far; sometimes you care about measurements from a particular set of probes (for example, measurements from probes within a particular country, or a geographic area, or a particular ASN). These two tables respectively contain the most recent list of probes, and an archive of the last 18 months of probe data. These tables mirror what we already publish in the public probes archives.
- yesterday: contains the same measurement result tables as the huge tables under the measurements dataset, but only for the full day immediately prior. We partition the backing measurement results tables on the start_time field into daily chunks. That in turn means the smallest span of data you can retrieve from the system (and be charged for) is one calendar day, regardless of whether you want to inspect 24 hours or 1 second of that data. The yesterday view is predictable: it will always gives you one full day's worth of data, and no more - a non-sampled, realistic day's measurement data for minimum charge.
- 24hours: is similar to yesterday, but provides the most recent data up to 24 hours old. This view presents itself as a rolling window, which means it will invariably span two calendar days. This view therefore brings the advantage that you can query for current events, with the disadvantage that it'll incur a higher charge for accessing two days of data rather than one. The results will consistently never be older than 24 hours from the time you query.
The probes tables expose a lot more metadata to help us understand the measurement data itself - we used this when writing about software probes, for example. The yesterday and 24hours views provide an easy way to query real data while constraining costs and without having to remember to filter on the start_time field. Each of the above is fairly straightforward, but we think extremely useful.
Decoding DNS
One upside of the RIPE Atlas DNS measurements is that the platform bundles the binary DNS payload from the answer (and, optionally, the query), and stores that. That's also a downside: it takes work to parse it, and a binary-packed data structure doesn't play well with data analysis tools like BigQuery.
We're helping to make that easy by parsing the data in-place inside BigQuery. To facilitate that, we're adding a new view: dns_decoded. This new view takes the existing data and decodes it inside BigQuery, taking a message buffer from something like this:

To something more like this:

From that alone, you can immediately see how to start querying against the contents of the full DNS dataset without having to download and parse it yourself.
Almost everything that's contained in the DNS buffer is parsed out to a reasonable representation of the data. Not all record types have parsing code yet, in which case a series of integers representing the original buffer are returned instead, but the main ones are there to start with. This is a ridiculously useful way to look at DNS data, and we'll fill in the gaps as we go. Bugs are of course possible: the code is available and pull requests are welcome!
The Measurement Horizon
In the measurements dataset, we initially exposed results from all main measurement types starting from 1 January 2020, then we stretched back a little further to 1 July 2019. We're changing this again, so that these tables instead expose the most recent 540 days of results (that is, about 18 months).
Our thinking is that we expect people typically want to query recent data, but occasionally will find it useful to compare year-on-year data. So we're providing a rolling window that comfortably covers that timeframe, and which also doesn't bind us to never-ending growth.
We'd like to hear whether that's a bad assumption though! Storing data is relatively cheap, but it's not cost-free, so we'd consider re-evaluating this if the value of storing data so old is minimal.
Note that this is the huge dataset, within which you really do want to filter on the start_time column (unless you don't mind blowing a hole in your wallet!).
Coming Up: Prototyping Datasets
Much of the data that we're putting into BigQuery mimics the structure of the results that you're already familiar with from the RIPE Atlas API. That implies a lot of redundant information in the result data, and some manual labour as a user to correctly parse the data into something meaningful. So while BigQuery allows you to process these datasets with relative ease, the activation energy required to derive value can still be high.
We're currently working with tables that are closer to prototypes than they are to finished products. These include:
- traceroute last hops: the traceroute data contains a ton of information, but sometimes you just want to know the general condition of the network from specific probes. We've been playing with this as a rudimentary way of aggregating all the traceroutes for a probe, and collecting what the last hop did. How many traceroutes timed out, vs how many reached their target, vs how many received specific error conditions? These can very clearly indicate outages or other network disruptions, without having to walk the full traceroute dataset.
- RIS table dumps and matched datasets: once we're happy with how we're inserting BGP table state, we'd like to expose these. In addition, we ought to be able to generate lookup tables for dates, mapping from IPs observed in the main measurements tables to their originating network prefix or ASN. There are caveats in this sort of data, but it's a useful mapping at this scale.
We have some other ideas also and we'll share more on these when we're ready!
Summary
Each of the above is a small iteration, but we think that in combination, they help our overall effort to open up RIPE Atlas measurement data in ways that are more natural for regular use.
As before, pointers for getting to the data are on this page, or take a look at our 'getting started' guide. Specific technical queries can be sent directly to us at atlas-bq@ripe.net. If you have general questions on how to make sense of the data, you can ask us directly on that email address, or discuss more widely on the ripe-atlas discussion list.
And finally, we're going to follow up soon with another article that shows a few easy queries to help folks get into the rhythm of querying the RIPE Atlas data inside BigQuery.


Comments 0
The comments section is closed for articles published more than a year ago. If you'd like to inform us of any issues, please contact us.