
Following up on earlier research, we're looking at IPv6 adoption statistics provided by various organisations once again. How far do they match, and if not, why not?
In 2018, we compared the per country IPv6 adoption statistics as measured by Facebook and APNIC. In general, we found broad agreement, though notable differences did exist for some countries. Two years later, on the occasion of the RIPE NCC::Educa IPv6-only event, we're revisiting the topic and expanding the comparison to include results from measurements by Akamai, Google and Cisco.
The topic of measuring IPv6 adoption has gained momentum ever since IANA allocated the last availabe IPv4 /8s to the RIRs in 2011 and, subsequently, the IPv4 pools held by the RIRs dropped to levels where justified needs could no longer be met. For the world at large, in order to move away from IPv4 and switch to an IPv6-only public Internet, wide scale deployment is essential. Statistics which provide insights in how countries are progressing in this area are, thus, of interest to decision makers. Google started publishing a time series of the percentage of users reaching them over IPv6 more than a decade ago. They also provide a map-based visualisation which shows the latest levels of IPv6 adoption per country. APNIC, Akamai, Facebook and Cisco followed, each using their own, independent, methodologies, to compute and publish per country (and in the case of APNIC, with a breakdown per ASN) IPv6 adoption statistics. Though at first glance different teams trying to measure the same quantity may look like a duplication of efforts, it is actually good research practice. When all are in agreement, it boosts confidence in the result. When the numbers diverge, it highlights uncertainties, which can be taken into account when evaluating the results. All in all, parallel measurements help advance knowledge.
Unfortunately, all of the five organisations publish their results on separate web pages, in distinctly different colour schemes; that makes it difficult to compare the measured IPv6 adoption rates. To alleviate this, we took the raw data used for each of the published maps on 1 June 2020, merged these into a single table and created a new set of identically-styled maps, keyed by the respective organisation's metric.
Grouped in a single web page this allows for a quick visual comparison of the results. In addition, when hovering over the countries, the popups in each map display the metrics from all sources, which eases comparing the exact numbers. Figure 1 below shows a screenshot for Akamai, APNIC, Facebook and Google. We leave out Cisco at this stage because their IPv6 adoption metric is a composite, the result of combining a number of aspects of IPv6 deployment; these results are thus not directly comparable to results obtained by the others.

Figure 1: IPv6 adoption as measured by APNIC, Akamai, Facebook and Google respectively
At first glance, we already see how the United States and India have different intensities of green on each of the maps; a clear indication that the different methods calculated substantially different levels of IPv6 deployment for these two countries. When we turn to the raw data, we in general find reasonably good agreement; for most countries the percentages differ by no more than a few percent. We find the spread, the difference between the lowest and highest measured IPv6 adoption rate to be larger than 5%, for only 28 out of 150 countries. The following table lists them in decreasing order:
| cc | Country Name | Akamai | APNIC | Spread | ||
| MF | St-Martin | 35.4% | 33.89% | 3.10% | 0.00% | 35.40% |
| IN | India | 58.0% | 68.69% | 62.89% | 45.74% | 22.95% |
| US | United States | 43.9% | 52.95% | 58.43% | 42.06% | 16.37% |
| CN | China | 15.3% | 15.77% | 3.59% | 0.25% | 15.52% |
| AE | United Arab Emirates | 30.5% | 42.28% | 32.30% | 28.29% | 13.99% |
| FI | Finland | 30.8% | 35.72% | 41.52% | 28.62% | 12.90% |
| EC | Ecuador | 20.1% | 11.13% | 19.82% | 23.37% | 12.24% |
| KR | Korea | 3.6% | 15.17% | 6.05% | 9.06% | 11.57% |
| NO | Norway | 15.8% | 22.52% | 18.18% | 12.54% | 9.98% |
| BT | Bhutan | 17.3% | 7.74% | 11.10% | 10.68% | 9.56% |
| TW | Taiwan | 37.7% | 45.10% | 47.10% | 38.74% | 9.40% |
| IE | Ireland | 17.3% | 24.93% | 25.21% | 23.64% | 7.91% |
| UY | Uruguay | 35.1% | 38.19% | 37.16% | 42.91% | 7.81% |
| CH | Switzerland | 46.9% | 42.56% | 39.18% | 39.18% | 7.72% |
| MM | Myanmar | 9.5% | 14.57% | 16.62% | 9.35% | 7.27% |
| LI | Liechtenstein | 3.9% | 6.94% | 0.05% | 3.82% | 6.89% |
| NZ | New Zealand | 21.8% | 25.27% | 27.50% | 20.68% | 6.82% |
| JP | Japan | 38.6% | 41.84% | 40.83% | 35.36% | 6.48% |
| DE | Germany | 47.1% | 49.69% | 53.12% | 49.02% | 6.02% |
| BE | Belgium | 55.1% | 59.72% | 53.75% | 55.31% | 5.97% |
| EG | Egypt | 2.5% | 7.75% | 2.34% | 1.87% | 5.88% |
| MX | Mexico | 36.7% | 36.09% | 31.94% | 37.80% | 5.86% |
| PR | Puerto Rico | 2.2% | 7.07% | 7.94% | 3.80% | 5.74% |
| TH | Thailand | 29.2% | 32.75% | 34.86% | 29.41% | 5.66% |
| SE | Sweden | 7.1% | 8.88% | 10.61% | 5.02% | 5.59% |
| RU | Russia | 7.2% | 7.01% | 9.43% | 3.85% | 5.58% |
| KE | Kenya | 7.7% | 12.97% | 12.35% | 7.72% | 5.27% |
| BY | Belarus | 4.1% | 7.75% | 9.36% | 4.30% | 5.26% |
Table 1: Countries for which measured IPv6 adoption rates diverge by more than 5%
The largest differences are found for the small island nation of St. Martin, in the Caribbean. Akamai and APNIC measure well over 30% IPv6 adoption, while Facebook sees 3% and Google 0.0%. However, with a rather small population, this could be a bias that has been introduced by a relatively low number of measurements. In the APNIC data we see wide fluctuations in the daily measured percentages for St. Martin, over the past 12 months.
The next two in the table, United States and India, are more intriguing. Being among the most populated countries in the world, low numbers of measurements should not be the reason for the observed differences. APNIC's result of 68% for India, for example, is based on over 30 million samples. The fact that Google arrives at 23% lower IPv6 adoption for the country, suggests the respective measurements do not reach customers of the different service providers in the same proportion. Typically, not all ISPs in a country are at the same level of IPv6 deployment. Table 2 shows how, for India, APNIC measured 95% for Reliance Jio, around 60% for Airtel Mobile, Vodafone and Idea Cellular, but less than 1% for BSNL and Airtel Broadband. If, compared to APNIC and Facebook, Google sees fewer users from the mobile providers and more from the broadband providers, that would explain Google's significantly lower result for IPv6 adoption in India. Why this happens is something we can only speculate about. Without insights in the market share of each ISP in a country and per provider results from Akamai/Facebook/Google, it is also difficult to tell which of the four metrics is closest to reality when numbers diverge as much as in Table 1 above. There is no clear pattern either, for instance that one metric always provides the highest and another always the lowest score.
| ASN | ASN Name | IPv6 Capable | IPv6 Preferred | Samples |
|---|---|---|---|---|
| AS55836 | RELIANCEJIO-IN Reliance Jio Infocomm Limited | 94.59% | 94.06% | 15,921,312 |
| AS45609 | BHARTI-MOBILITY-AS-AP Bharti Airtel Ltd. AS for GPRS Service | 62.68% | 62.21% | 7,440,788 |
| AS38266 | VODAFONE-IN Vodafone India Ltd. | 58.01% | 57.29% | 2,324,008 |
| AS45271 | ICLNET-AS-AP Idea Cellular Limited | 64.39% | 63.46% | 1,719,304 |
| AS9829 | BSNL-NIB National Internet Backbone | 0.16% | 0.12% | 837,878 |
| AS24560 | AIRTELBROADBAND-AS-AP Bharti Airtel Ltd., Telemedia Services | 0.35% | 0.22% | 552,378 |
| AS17488 | HATHWAY-NET-AP Hathway IP Over Cable Internet | 0.16% | 0.08% | 240,760 |
| AS24309 | CABLELITE-AS-AP Atria Convergence Technologies Pvt. Ltd. Broadband Internet Service Provider INDIA | 6.69% | 6.45% | 217,478 |
| AS18209 | BEAMTELE-AS-AP Atria Convergence Technologies pvt ltd | 0.30% | 0.13% | 195,530 |
| AS133982 | EXCITEL-AS-IN Excitel Broadband Private Limited | 0.14% | 0.08% | 140,204 |
Table 2: IPv6 user capabilities of the top 10 ASNs in India, as measured by APNIC.
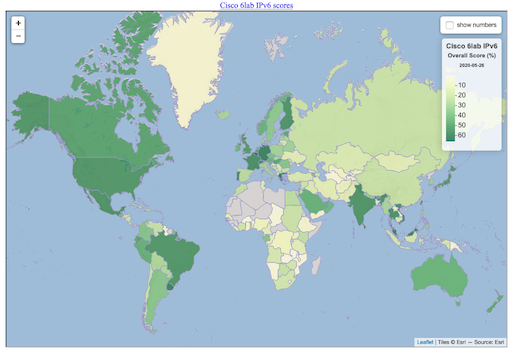
As stated earlier, we left out results from Cisco in the above comparisons. The reason is that, unlike the others, Cisco's overall IPv6 deployment score is a composite metric, which not only looks at the percentage of IPv6 users in a country, but also take statistics on IPv6 transit ASNs, as well as content reachable over IPv6 into account. The metric thus recognises that next to users, a country also needs (local) services to work with IPv6. The screenshot in Figure 2 gives an idea how the world is doing with respect to IPv6 under this metric. Compared to the user-based adoption statistics, many countries see their IPv6 adoption rates rise. However, no single country reaches 66% or more. And when ranking the different countries, we see the United States drop from ninth place in Google's IPv6 user adoption, to the nineteenth place in Cisco's overall IPv6 adoption stats. Apparently, other countries are doing a little better in nation-wide IPv6 infrastructure aspects.

Figure 2: IPv6 adoption map, keyed by Cisco's overall metric
Conclusion
The per-country IPv6 user adoption statistics provided by Akamai, APNIC, Facebook and Google are in reasonable agreement for the large majority of cases. Differences of a few percent are within an acceptable range and do not really change the picture painted by these statistics. However, for a number of countries, the results diverge by much more than we would expect from pure statistical fluctuations. For some reason, the measurements by the different organisations appear to reach substantially different subsets of users. Which number is closest to reality for those countries, is hard for us to tell. We welcome input on that in the comment section below. Cisco's approach with a composite metric, taking a number of IPv6-related aspects into account is an interesting one. However, it also highlights the difficulties with summarising the complex issue of a country's readiness for IPv6 into a single number. One always needs to check the results from the different components to understand how the overall score of a country can be improved.
Comments 6
The comments section is closed for articles published more than a year ago. If you'd like to inform us of any issues, please contact us.
Kurt Kayser •
Hello, thanks for taking this adoption topic to the next level of credibility. I always wondered, why there is such a large discrepancy between the IXP-v6-traffic numbers and CDN-reported figures. If I may compare the 4 largest IXPs with their traffic way above 20Tb/s in summary, they don't seem to exceed 5-10% of v6 traffic. Sure much traffic could bypass the large IXPs, but not 40% - right? I would be glad to see IXP supported figures that lead to a very useful v6-adoption picture currently. Best regards, Kurt
Kurt Kayser •
Another comment I would like to make. There is subtle difference between v6-enabled serviced or clients and real traffic happening. I would assume that both eyeball-networks and CDN-networks work simultaneously to enable v6 capabilities around the clock. Still, as long as v4 works fine, there is no hard push to move towards v6 end-to-end (killer-app needed?) Some mobile networks have deployed v6-only in transport but interface with client-devices v4 and v6 with transitions techniques. Is there any way to report v6-enabled services/customers vs. v6-actual-traffic that runs across all data-lines? I mean i.e. Netflix should have quite some information about their playout-statistics (transport capability, performance, quality, etc.) They could contribute to such statistics that is not publicly visible, but highly interesting to the community, I assume. Just an idea, regards, Kurt
Abraham Y. Chen •
Hi, Kurt: You are looking into a critical aspect of the IPv6 roll-out that few colleagues seem to be aware of the subtlety in the definition of the metrics. There has been an ongoing in-depth thread on CircleID that is specific about the unexpected large discrepancy between the publicized "adoption rate" versus the actual "traffic volume". It should provide some information to your question. After you have a chance to review that thread, we can continue the discussion on either forum. Regards, Abe (2020-06-09 07:47EDT)
Abraham Y. Chen •
Hi, Kurt: The URL to the cited CircleID discussion is http://www.circleid.com/posts/20190529_digging_into_ipv6_traffic_to_google_is_28_percent_deployment_limit/ Sorry for the inconvenience due to the omission. Abe (2020-06-11 06:56 EDT)
Erik Nygren •
Some CDNs have direct connections to many of the large network providers around the world so traffic does bypass the IXPs. (I did some spot checks for IPv6 traffic for some large ISPs nearby an IXP that publishes IPv6 traffic metrics, and 90% to 100% of the IPv6 traffic bypassed the IXP and went directly to the end-user networks.) Another dimension is that not all CDN content is dual-stacked as this can be up to the customers. While they may be encouraged to dualstack, some CDN customers chose to leave content as IPv4-only.
Abraham Y. Chen •
Hi, Erik: You may want to review the following article about how much Internet traffic is diverted through the IXPs. https://www.theregister.com/2018/08/28/ipv6_peering_squabbles/ In essence, this article reasoned that because the peering arrangements for IPv6 was not as mature as those for IPv4, larger portion of IPv6 traffic compared to that of IPv4 was being diverted to the IXs, such as AMS-IX. In other words, if peering arrangements for both IPv4 and IPv6 are about the same, IPv6 traffic seen in the AMS-IX statistics will be even lower! Abe (2020-08-24 15:38 EDT)