HTTP measurements from RIPE Atlas probes are only possible towards RIPE Atlas anchors. However, when it comes to measuring the connectivity and latency of web servers on the network level, an alternative exists, which we call TCP Ping: a traceroute with special options that mimic the TCP handshake that takes place when an HTTP connection is established. In this article we compare the results of large scale HTTP and TCP Ping measurements.
Introduction
The topic of HTTP measurements from RIPE Atlas probes has been discussed by the RIPE Atlas community several times in the past. Because of the potential risks we would put RIPE Atlas probe hosts in by allowing general HTTP measurements from or to any probes (see Ethics of RIPE Atlas Measurements for more details on this), HTTP measurements can only be performed with RIPE Atlas anchors as target. However, if your goal is to gain insight into the reachability and network latency of a web server, an alternative would be as follows: schedule a TCP traceroute to the web server's IP address using port 80 as a target, a packet size of zero, and an initial time-to-live (TTL) long enough for the first traceroute attempt to immediately reach the destination address. As this mimics the behaviour of the TCP handshake that takes place when setting up an HTTP connection, the results are expected to measure the same network delays.
Analysing the results of a large set of TCP Ping and HTTP connect time measurements from identical sources to identical destinations, we find the two are equivalent for operational purposes: within the level of precision needed, the two methods produce similar round trip times to a web server on the network level. The remainder of this article discusses in depth how we reached that conclusion.
Setting up a TCP Ping measurement
In Figure 1 below, we illustrate how these measurements can be set up using the "create a new measurement" interface on the RIPE Atlas website. 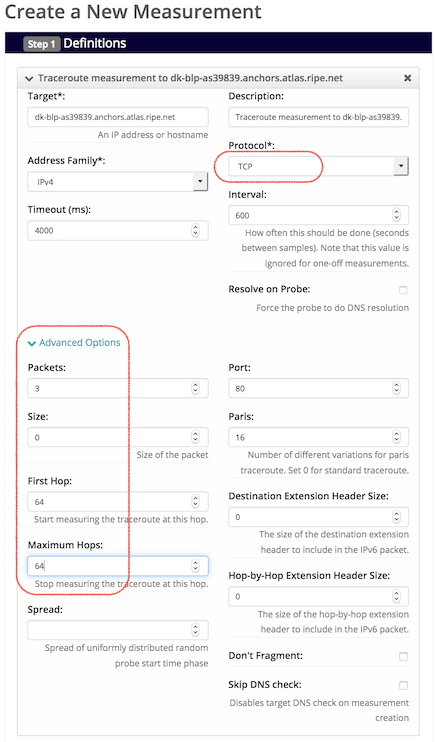
Figure 1: Creating a "TCP Ping" measurement
As you can see in the image above there are four important settings and options that need to be changed from their defaults after selecting the traceroute type and specifying the target of the measurements:
- Select protocol TCP
- Open the 'Advanced Options' panel
- Set packet size to zero
- Set the inital TTL ("first hop") to 64 or higher
- Set "maximum hops" to the same value
The destination port has to be port 80, but as the form already defaults to that value for TCP traceroute, there is no need to change that.
Analysing our measurements
To verify if HTTP connect and TCP Ping are equivalent, we created a set of RIPE Atlas measurements using all sources and destinations found in the anchoring measurements. This resulted in roughly 9,400 RIPE Atlas probes (including anchors) measuring connectivity to a total of 260 IPv4 and 240 IPv6 addresses - the IP addresses of the RIPE Atlas anchors active at that time. Run for 24 hours at a frequency of once every 10 minutes, every probe sampled each of its destinations 144 times, both with HTTP and TCP Ping.
In order to compare results of the different methods, we first filtered out results which had a dubious response or no response at all. Packets that experienced timeouts, or that encountered network errors, host unreachable errors, or other errors were all skipped. It is still possible for round-trip-time (RTT) values to be included in these measurement results, but they cannot be trusted to be a true measure of the RTT to the destination: network or host unreachable replies could for instance be sent by network equipment in between. To increase confidence that packets reached their destination, we also required status code 200 (OK) in the HTTP response and Syn/Ack flags set in the TCP Ping reply packets.
Figure 2 shows the success rate - replies with Syn/Ack or status 200 respectively - for HTTP and TCP Ping on a per probe basis. Because TCP Ping is in essence a traceroute, it sends three packets to the destination at each sample. Most of the probes perform rather well: more than 7,000 show between 95% and 100% success rate in reaching the destination. A fraction of the probes seem to have problems with TCP Ping, as indicated by the small cluster in the 0-5% success bin. The graph also shows the second and third packet in a TCP Ping tends to be less successful; some probes do not receive (good enough) responses for these. We therefore use the first result, the round-trip-time of the first TCP Ping packet, in the analysis which compares TCP Ping with HTTP.
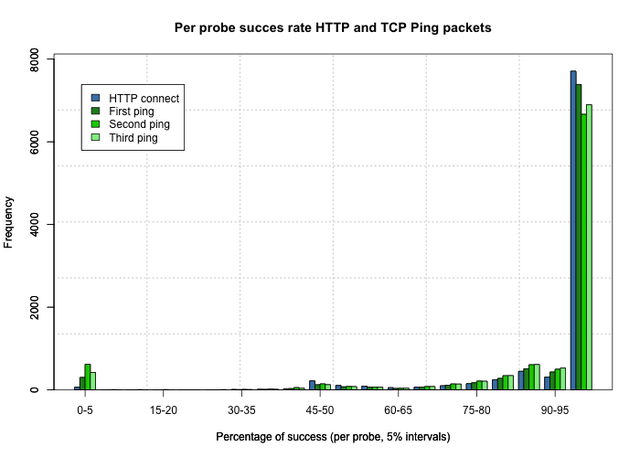
Figure 2: Distribution of success rate of HTTP and TCP Ping success on a per probe basis
Comparing results
With the raw data sets cleaned to the best of our ability, we turn to the main questions:
Are round trip times measured by TCP Ping equivalent to HTTP connect times? Do they measure the same underlying network delay?
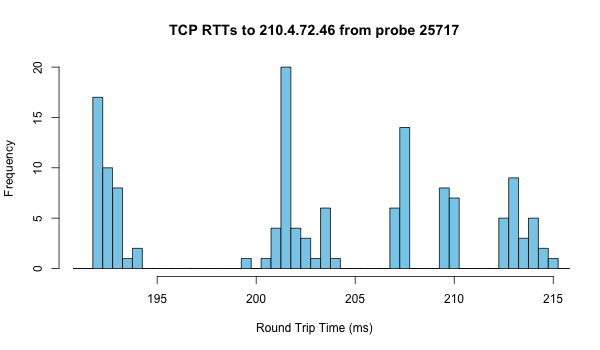
Because the measurements do not run at the exact same time, we cannot expect all results from TCP Ping to be identical to HTTP connect. Even the HTTP connect times from one probe to one destination will show variations during the day. Figure 3 below illustrates this. It shows an example of what the distribution of HTTP connect times measured throughout the 24 hour period looks like for one specific probe to an anchor destination. Grouping results in bins of 0.5ms, we can see five distinct clusters , around 193ms, 203ms, 208ms, 210ms and 213ms. For TCP Ping (Figure 4) the distribution for this probe/destination looks similar, but the height of the bins differs. This indicates the measured values are not exactly the same as with HTTP. However, because of the limited resolution, the bins being 0.5ms wide, we cannot see by exactly how much the values differ.
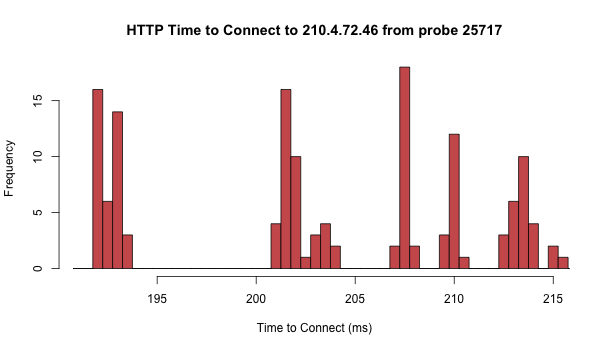
Figure 3: Example of HTTP connect time distribution

Figure 4: TCP Ping distribution for same probe and destination
A better way to compare is to look at the cumulative distribution plots. For each measured value of the round-trip-time between a probe and a destination, these plots show the fractions of measurements with an RTT less than or equal to the value under consideration. In other words, when we find a value of 0.6 at a measured time of 200ms, it means 60% of the measurements from a probe to an anchor reported an RRT of 200ms or less. Figure 5 shows the cumulative distribution for both the HTTP connect and TCP Ping times for the same source probe and destination used in Figures 3 and 4 above. The five clusters in round trip times are clearly visible as distinct steps. We can also see how the lines for TCP Ping and HTTP almost overlap; the observed values throughout the day never differed more than (a fraction of) one millisecond.
Taking into account general uncertainties in measuring round-trip-times, we can state the two methods of measuring webserver connectivity produce identical results for this probe/destination combination.
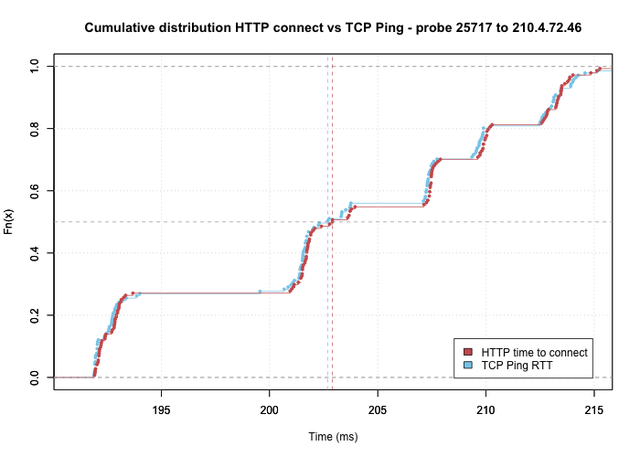
Figures 5: Observed HTTP Connect and TCP Ping distributions for same source and destination as Figure 3 & 4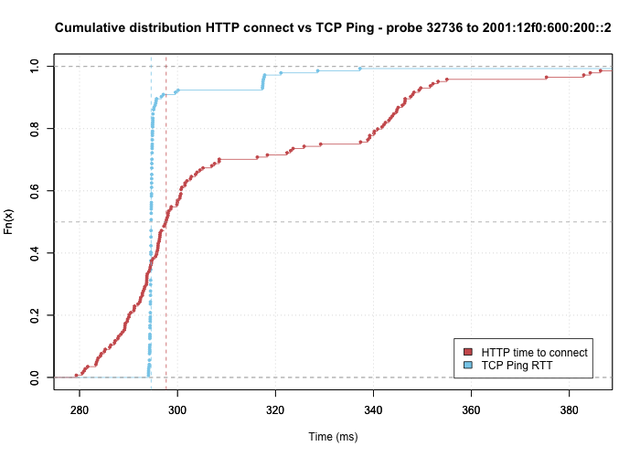
Figures 6: Example of results where HTTP Connect and TCP Ping distributions differ significantly
However, when inspecting a sample of the cumulative distributions, we did find cases were the TCP Ping and HTTP connect distributions differed by more than the measurement error. Sometimes the differences could be understood as differences in load-balancing: either by chance or because, due to unfortunate timing, different paths from a probe to a destination were used in equal numbers by the two methods; HTTP and TCP Ping results did cluster around the same values, but each cluster had largely different numbers of results. At other times, the cause of the observed difference was less clear. In extreme cases, we found some of the TCP Ping RTT distribution to be much more narrow than the distribution of the HTTP connect times. The latter were much more spread out than the former. Figure 6 shows an example of this behaviour. At the moment we do not fully understand the cause of such differences, and it'll take further research to learn what is happening. For now we want to quantify how often - i.e. in what percentage of the measurements - results from HTTP connect and TCP Ping are close enough to consider them equivalent for operational purposes.
Quantifying observed differences
To quantify the differences between HTTP and TCP Ping we summarise the distributions of measurement results from one source probe to one destination in two numbers: the median and the interdecile range.
The median
The median is an indication of what value to expect from a single TCP Ping or HTTP measurement. Representing the middle value of the distribution, there is a 50% chance of a result being higher and a 50% chance of it being lower than the median. In Figures 5 and 6 above, the median of the HTTP and TCP Ping distributions are represented by, respectively, red and blue dashed lines.
The interdecile
The interdecile range is a bit more complex. It measures the spread in the individual measurement results. However, instead of looking at the difference between the highest and lowest values measured, it uses the distance between the 10th percentile and the 90th percentile. This makes the ranges less susceptible to occasional outliers and thus more representative of the underlying distribution.
In Figures 7 and 8 below we graph the two summary statistics for all 65,544 source/destination pairs measured. Each figure has two plots. On the left a scatter plot, with the metric for HTTP on the x-axis and the metric for TCP Ping on the y-axis. On the right a histogram of the difference between the TCP and HTTP metrics, where each bar counts the number of source/destination pairs with an observed difference in median or interdecile range in 0.5ms bins.
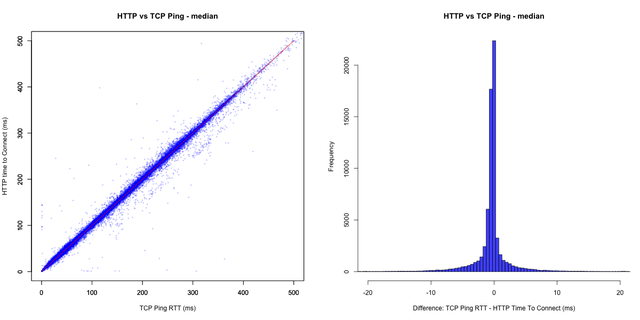
Figure 7: Median values of HTTP Connect and TCP Ping times
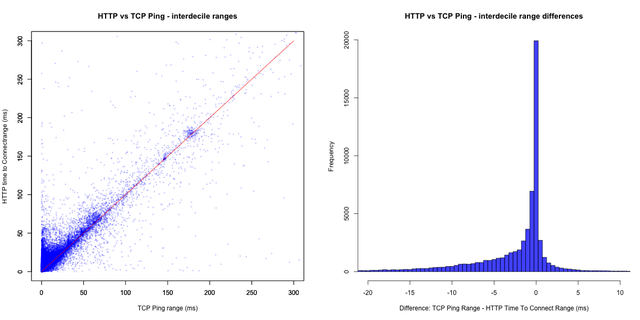
Figure 8: Interdecile ranges of HTTP and TCP Ping times, a measure of the observed spread
Both the median and interdecile range histograms show a strong peak around 0ms. In the scatter plots, most points are near the red line which represents fully identical metrics for HTTP and TCP Ping. This is a sign that for a large part of the measurements, it takes about the same amount of time to reach a web server via HTTP connect or TCP Ping. Put in numbers we find that for 68% of the probe/destination pairs, median values differ by less than 1ms and interdecile ranges differ by less than 6ms. However, where the distribution of medians is close to symmetric - centered around 0ms - the distribution of interdecile ranges is skewed to the left. For part of the measurements between a specific source and destination, the distribution of TCP ping values is more narrow than that of the HTTP connect times. As in the example shown in Figure 6 above, this means round-trip-times found in HTTP measurements are more spread out than those in TCP Ping between the same source and destination. We do not know the exact reason for this, but when compared to round trip times of 100 milliseconds, a difference in spread of 5 - 15ms may still be acceptable to assess network performance.
Conclusion
Although TCP Ping and HTTP measurements do not always provide results that are identical within measurement errors, the parameters of the observed distributions are such that, in a large majority of cases, the two methods can be considered to be equivalent for operational purposes. Results from TCP Ping are likely to fall in the same range and have similar median values than results from HTTP connection attempts. TCP Ping thus offers a viable alternative to measuring web servers on the network layer.

Comments 2
The comments section is closed for articles published more than a year ago. If you'd like to inform us of any issues, please contact us.
Stéphane Bortzmeyer •
I modified a bit my tools (following Vesna Manojlovic's excellent talk at RIPE NCC Educa yesterday https://www.ripe.net/support/training/ripe-ncc-educa) to implement the options required for "TCP ping". See https://labs.ripe.net/Members/stephane_bortzmeyer/using-ripe-atlas-to-debug-network-connectivity-problems for a description of these tools/. Here is an example: % atlas-traceroute -f -r 3 --protocol TCP --size=0 --port=43 --first_hop=64 --max_hops=64 $(dig +short +nodnssec AAAA whois.ripe.net) Measurement #9721999 Traceroute 2001:67c:2e8:22::c100:687 uses 3 probes 3 probes reported Test #9721999 done at 2017-10-06T14:34:57Z From: 2601:646:8d00:6951:fa1a:67ff:fe4d:6a0c 7922 COMCAST-7922 - Comcast Cable Communications, LLC, US Source address: 2601:646:8d00:6951:fa1a:67ff:fe4d:6a0c Probe ID: 12908 64 2001:67c:2e8:22::c100:687 3333 RIPE-NCC-AS Reseaux IP Europeens Network Coordination Centre (RIPE NCC), NL [160.926, 161.434, 163.041] From: fd00:8494:8c40:8c12:16cc:20ff:fe48:cf02 None None Source address: Probe ID: 27041 Error: connect failed: Network is unreachable [Note added manually: probably fascist firewall. Outgoing whois is often blocked.] From: 2003:6:21f8:7957:a62b:b0ff:fedf:fd2c 3320 DTAG Internet service provider operations, DE Source address: 2003:c3:e3e5:a57:a62b:b0ff:fedf:fd2c Probe ID: 28991 64 2001:67c:2e8:22::c100:687 3333 RIPE-NCC-AS Reseaux IP Europeens Network Coordination Centre (RIPE NCC), NL [35.646, 35.717, 36.512] TODO: aggregate results to show median and average, as in "ordinary ping" tests: % atlas-reach -r 3 -g 9721999 $(dig +short +nodnssec AAAA whois.nic.fr | tail -1) 2 probes reported Test #9722014 done at 2017-10-06T14:40:01Z Tests: 6 successful tests (100.0 %), 0 errors (0.0 %), 0 timeouts (0.0 %), average RTT: 111 ms
Vesna Manojlovic •
Thanks, Stephane! In addition to Stephane's tools being updated to enable this new measurement, Hugo Salgado "patched" the "official" CLI toolset, and since then the new version has been published by Chris Amin: https://github.com/RIPE-NCC/ripe-atlas-tools/ So now there are multiple ways to measure latency towards your web server using command-line tools!