There was a power outage last week in the north of The Netherlands, a country with a very high density of RIPE Atlas probes. This density provides us with some interesting data and visualisation.
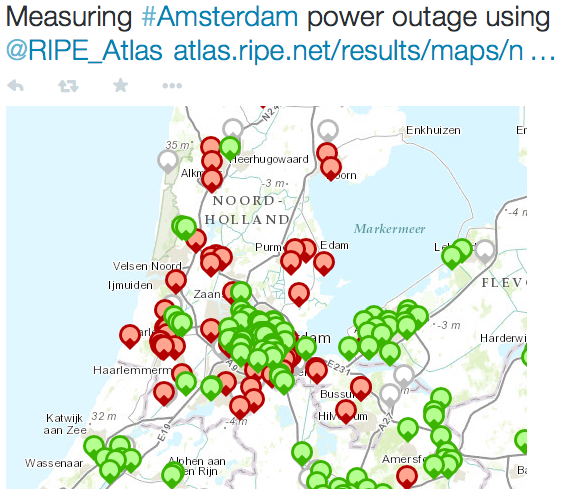
Last Friday, 27 March 2015, parts of Amsterdam and northern parts of The Netherlands were hit by a power outage. We were able to monitor this quite closely using the RIPE Atlas network. Figure 1 is a snapshot of the RIPE Atlas network at 10:30 during the outage. The red icons show the RIPE Atlas probes that were disconnected at that point. The green icons mark those probes that were still online.

The majority of probes in this area were disconnected around 09:37 and then gradually came back online at various times up to 11:55 local time. Combining the uptime logs from all probes in this area, we created the following map. You can see that the outage took place at 09:37 local time and by 11:35 local time a lot of probes seemed to have come back online.
Figure 2: CartoDB map showing the RIPE Atlas probes in the north of The Netherlands during the power outage
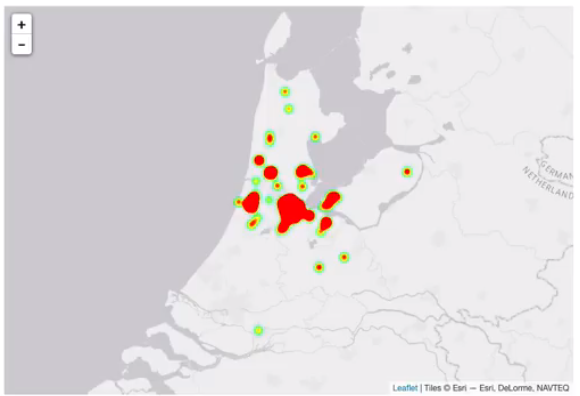
During the RIPE Atlas hackathon this weekend, one of the teams also took the power outage as a motivation to produce a heat map that shows which RIPE Atlas probes in the area went down during the incident.
Figure 3: Heat map showing disconnected RIPE Atlas probes in the north of The Netherlands during the power outage
More information about the results of the hackathon will be published here on RIPE Labs shortly.
These visualisations show that, with a high enough RIPE Atlas probe density, we can measure and visualise the effects of significant events such as regional power outages.


Comments 0
The comments section is closed for articles published more than a year ago. If you'd like to inform us of any issues, please contact us.