
In our earlier analysis of Ukraine back in March 2022, we looked at factors that contributed to the resilience of the country's Internet since the outbreak of the war. A little over a year on, we draw on data from RIPE Atlas and RIPE RIS to investigate what has changed.
Shortly after the outbreak of war in Ukraine, we published an article looking at how the country’s Internet was holding up. In our initial analysis, we observed that the Ukrainian Internet – as viewed from RIPE Atlas and other datasets – was very decentralised at multiple levels, and had a lot of IXPs that facilitated very local interconnection options. We suggested that the shape of the Internet in the country was an important reason for its resilience in the face of the terrible damage being caused by the invasion; i.e. loss of infrastructure, power cuts, etc.
In this article we look at what has changed for the Ukrainian Internet after more than a year of war, from the perspective of data we collect in RIPE RIS and RIPE Atlas.
Connected RIPE Atlas probes
One very basic metric we have about the Internet in Ukraine is the number of connected RIPE Atlas probes over time. When many probes disconnect at the same time, this tells us something about the local situation - e.g. that an outage has occurred. The longer term view tells us something about the observability of the Internet in a particular area.


In the three graphs above we see the number of connected RIPE Atlas probes in Ukraine over 2022. A clear drop is seen around the start of the war. The middle graph shows a slow but steady decline of connected probes.
The last third of the year shows a decline in connected Atlas probes, and starting in October also increased instability - the line is more “wiggly” - which is due to probes connecting and disconnecting more frequently. This coincides with the phase of the war where Russia started attacking Ukrainian infrastructure, including electrical power. This resulted in electrical power outages, and the graph above shows the effect that this has on the number of RIPE Atlas probes online.

In 2023 we keep seeing the instability, likely due to the power situation, but we also see more stability since mid-February and the start of March, which correlates with the time that the energy infrastructure suffered less attacks and became more stable.
All of this stresses how important electrical power is for the Internet. As of this writing the attacks on energy infrastructure have lessened, and with warmer weather around the corner, energy may become less of a problem for the upcoming period.
The view from BGP (RIS)
What can BGP data tell us about the changes in the Ukrainian Internet?
First, using BGP data from RIS, we look at how Ukrainian networks depend on each other and on foreign networks. Starting from the figures on their own, in the table below, you see the differences in number of ASNs and interdependencies with respect to a snapshot from before the war (2022-01-01) and a more recent snapshot (2023-04-01) and only use data from RIS peers that were feeding data for both snapshots. We used RIR country codes (headquarters of ASNs) to determine country codes for networks that we see having links in BGP data from RIS. Although these country codes are not necessarily the main country that a network operates in, they are accurate enough to paint a clear picture of the shape of the Internet in a particular country.
We take all ASNs for the given country, and use RIS to find all the direct links these ASNs have - either between two ASNs for the given country, or where one of the ASNs depends on a foreign ASN. Of these links, we only look at those where there is a strong dependency of one network upon the other, as determined by AS-Hegemony.
We chose to only show links where we see a strong dependency (>10%) in AS-Hegemony. These are likely transit links that have contractual agreements underlying it, but this is something we cannot determine from the BGP data alone. (Note: If we take all links we see - including lateral peering - for this analysis, it becomes much more difficult to see patterns and trends)
Two main things are noticeable. First, there is a small but significant decrease across all these indicators. And second, in spite of this, the richness of the interconnectivity of the Ukrainian Internet remains. If we look at the countries the upstream networks are registered under, the drop in Russian networks is very noticeable. In fact, further analysis revealed that the remaining Russian networks all seem to be involved in transit for the occupied territories, whereas before the war they also played a significant role in transit for the rest of Ukraine.
| 2022-01-01 | 2023-04-01 | Diff | |
|---|---|---|---|
| Number of UA ASNs | 1781 | 1677 | -110 (-6.2%) |
| Foreign upstream ASNs | 112 | 99 | -13 (-12%) |
|
Country of Registration for Foreign upstream ASNs (Top 5) |
RU 48 US 10 NL 8 GB 8 PL 6 |
RU 21 US 13 PL 10 NL 9 DE 7 |
|
| Domestic links | 2055 | 1936 | -119 (-5.8%) |
| Intl. upstream links | 662 | 600 | -62 (-9.4%) |
As an example of the ambiguity of country codes we can look at the RU-registered network Miranda Media (AS201776), which connects with smaller local networks that might either be RU or UA registered - but these networks are all in Crimea, and since the war Miranda Media together with UMLC connects roughly the occupied parts of Kherson and Zhaporizhzha oblast as well as Crimea.
Whilst the table shows a summary of changes that happened, it doesn't show the underlying richness and complexity of these changes. For a better perspective we try to visualise this in the next section.
So what does the Ukrainian Internet look like?
To get a better overview of the structure of the Ukrainian Internet, we employed a visualisation that would help give a clear impression of its complexity. The visualisation we came up with can be reproduced for any country, thus allowing us to draw useful comparisons. We do this here by visualising the Internet in Ukraine, Germany, and Turkey. As you'll then see, the same visualisations can also help show how the Internet has changed, and at the end of this section we'll zoom in on a few particularly interesting topological features.
First, the Ukrainian Internet. Keep in mind, we only display networks where there is a significant dependency from one network on the other (typically a transit relationship). All Ukraine registered networks are in grey and the upstream international networks they link to are in pink (for contrast). In this picture we sized the ASNs by in-degree - i.e. by how many networks directly depend on each ASN. This picture gives an idea of just how complex the Ukrainian Internet is (we’ll go into some of the details in a moment):

With this view of the Ukrainian Internet in place, we then turn to Germany. Germany has roughly twice the population of Ukraine, but its Internet is also very distributed and complex, as can be seen if it is visualised with exactly the same method as the Ukrainian Internet. The picture that emerges here is in agreement with the Qrator National Internet Segment Reliability Index for 2022, where both Germany and Ukraine score very highly for their predicted reliability.

Finally, if we compare this to the Internet in Turkey (a country that has a similar population to Germany), the picture is very different. The Internet in Turkey has a much simpler structure, with a relatively large dependency on a few networks.

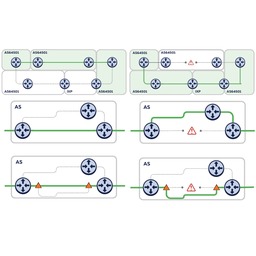
Can we see how the Internet in Ukraine changed from before the war to now? We visualise this by showing which inter-AS links were stable (in grey) versus links that either appeared (in green) or disappeared (in red).1 This is shown in the images below. In this image the nodes are colored as follows:
- Grey for Ukraine-registered networks
- Pink for Russia-registered networks
- Magenta for all other networks

As above, nodes are sized based on their in-degree or number of direct incoming links. This shows the importance of this network as an “aggregator”, but not necessarily its overall importance, because this doesn’t take the number of networks further downstream into account.
First we see a couple of interesting features. The Internet in Crimea (cluster at 11 o’clock) is separate from the rest of the Ukrainian Internet, as well as the Internet in Donbas (cluster at 2 o’clock). We see the Crimea- and Donbas-clusters get their Internet connectivity via Russian entities:
- Crimea-cluster: via Crelcom (AS6789 -- a Crimean ISP that was Ukraine-registered 2009-2012 and Russia-registered before and after that), Miranda Media (AS201776), UMLC (AS48084) and CrimeaCom (AS28761).
- Donbas-cluster: via AS48276 (IPSvyaz), AS43201 (Lugacom), AS29031 (Lugansk Telephone Company) and AS52091 (Level MSK).
As an aside, like our colleagues over at GEODE (who have been performing a related analyses on this topic), we use Gephi to visualise these nodes. The graphs we create in this case is actually interactive when viewed on a locally installed Gephi instance, which provides another dimension of clarity. We would love to develop this further such that this interactivity is also available to anyone who'd want to explore this in more detail.
For now, to better illustrate the difference between loss and gain we take the same picture, but split it in two as follows:
- The first image shows the links as they were seen in 2022-01-01 snapshot, but here links that were still visible in the 2023 snapshot are coloured grey and links that were no longer visible in the second snapshot are coloured red.
- The second image shows the links as seen on 2023-04-01, with links that were visible in the first snapshot in grey again, and new links that appeared in the mean time in green.
We hope this gives a more clear impression of the disconnect of the Crimea and Donbas networks from the main Ukrainian Internet.


Zooming in
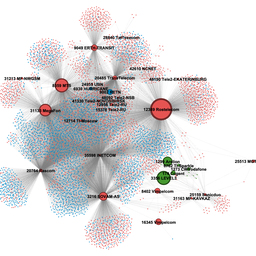
As this visualisation is currently not interactive for the reader, I'd like to zoom in on parts of the graph gives us some more insights.
In this first zoom in we see new connections to Miranda Media (AS201776) highlighted. This network (together with UMLC) is known to provide connectivity for Crimea via the Kerch Strait bridge. What we see in this zoom is that a few new networks are connected to this network. We further investigated these networks and labeled the city where they are headquartered in this zoom in. What is interesting here is that these are all cities in the occupied parts of Kherson and Zaporizhzhia Oblast.

In the next zoom we see 2 networks that are headquartered in Mariupol. These were connected to the "main" Ukraine Internet, but in our latest snapshot they are connected via the Donbas partition, as can be seen here.

These zooms show a split in routing in the occupied territories. On the one hand we see Mariupol and occupied territories to the east of Mariupol are connected via Donbas, whereas the Internet in the occupied parts of Kherson and Zaporizhzhia Oblast seems to be routed via the Crimean tentacle of the Russian Internet.
Summing up so far...


Our view of the past year from the perspective of RIPE Atlas and RIPE RIS would seem to raise some cause for concern. The big picture is: more connections have been lost than gained across the Internet in Ukraine, and there has been a gradual decline in the number of connected RIPE Atlas probes.
But there is also some reason for hope. A significant amount of new links are visible, and that "wiggly-ness" of the connected probes has evened out of late, indicating a more stable Internet in recent months.
One other factor we haven't touched on here relates to the number of IXPs we see in Ukraine. We do monthly mesh traceroutes between probes in each country. Looking at Ukraine in these snapshots, we see the number of networks available for these measurements varies - as expected given the variation in the overall number of probes connected in Ukraine over this period. But at the same time we see the number of IXPs between these probes remain stable. This is an indication that these important infrastructure elements continue their role in keeping local traffic local.
Other observations
Much has happened over the course of this war, and many events had an effect on the network. Here I want to zoom in on some other observations as examples of what we can extract from the measurement data.
Example 1: A specific probe in Kherson
We have a few probes around Kherson. We got in contact with one of the probe's hosts, and he told us the story behind the probe: It is actually in his parents house in Kherson. They made it through the occupation unharmed, and for some of this period the probe in their house was providing valuable information on how the network changed around occupation and liberation of Kherson.
In the figure below we see how the latencies into Russian networks from a probe in Kherson changed over the last year. We use the minimum RTT for a given day between a probe and any ASN/IXP that was visible in the traceroutes this probe took during the day as the basis for this analysis. A very related analysis from the perspective of a measurement node in Kyiv , shows very similar results.
Kherson was occupied by Russian forces on 2 March 2022 and went back to Ukrainian control on 11 November. We see a significant drop in latencies around the beginning of June, months after Kherson got occupied by Russian forces. This provides some insight into the speed of the Russification of Internet in the territories that Russia occupies. At the same time the latencies into the rest of Ukraine and the Internet “to the west” increased significantly. The plot below shows latencies for AS174 (Cogent, a tier1 transit provider), DE-CIX and Datagroup (one of the larger Ukrainian networks).
When Kherson was under Ukrainian control again, latencies reversed to their pre-occupation levels pretty quickly. The probe was offline for much of November (the grey line at the bottom of the follow graphs shows when the probe was online), but when it came back online again, it showed pre-occupation level latencies.


Interestingly during the occupation some networks further to the east also showed lower latencies (Delta group in Azerbaijan, and China telecom in China), as can be seen in the figure below. This is probably because Rostelecom has more direct routes to these networks than the networks that connected the probes before and after occupation.

Example 2: Kerch Strait Bridge explosion
The second example of what we can see in data explores the effects of a well documented event: The Kerch Strait bridge explosion that happened on 8 October 2022. First we look at BGP data via the Internet Health Report, which uses RIS data to determine dependencies between networks. There are two networks that are known to provide connectivity via this bridge: Miranda Media and UMLC.

Miranda had a significant uptick in the number of downstream networks (blue line) that depended on it. This matches directly with the reported time of the explosion of the Kerch Strait bridge at around 3am UTC. At the same time UMLC (AS48084) lost a significant number of downstream networks around the same time (blue line at the bottom) and also started to depend more on Miranda Media.

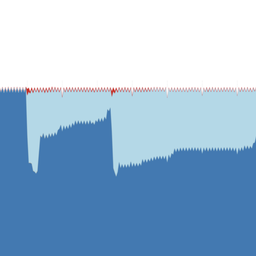
Latencies
We see an effect of this when we zoom into latencies for specific RIPE atlas probes were UMLC is seen frequently in traceroutes. What we see is that these probes during this “impact period” (3am until midnight) still see UMLC in the path, but that latencies beyond UMLC increase by 5-10ms. We didn’t find evidence of this impacting latencies for probes behind Miranda Media.
The image below shows latencies towards a UMLC router in Rostov-on-Don from the perspective of a RIPE Atlas probe in Crimea. Before 3am we see 2 latency bands, and after we only have the upper (slower) latency band remaining, indicating a small but noticeable difference in the infrastructure.

What we can conclude from this is that the Kerch Bridge attack likely also damaged internet infrastructure, probably fibre that was in use by UMLC, which caused changes in BGP, but on the data plane we see evidence of this only having a very limited impact, and there possibly being enough capacity to absorb the changes.
Conclusion
There is a lot that the data we collect with RIPE RIS and RIPE Atlas can tell us about how the Internet in Ukraine has fared since the beginning of the war. While the overall picture is complex, and will no doubt require much further analysis to be properly understood, the observations we have shared here hopefully help shed light on some relevant developments.
On the one hand, we see a small but significant decline across multiple indicators - i.e. connected probes, ASNs, interconnections. This is no doubt inevitable after such a prolonged period of war. And yet despite this, there is a lot of new connectivity and we see a relative stability with the IXPs, which both serve as a signal of the ongoing resilience of the country's Internet.
Many smaller and bigger events taking place as the war continues continue to shape the Internet in Ukraine. We will continue to monitor these, and we hope that the tools and services we provide will continue helping others with their own analyses.
In the mean time, a key factor in keeping Ukraine connected continues to be the hard work of the netops in Ukraine, the people who keep the Internet running. If you want to support them, please consider helping out via the Keep Ukraine Connected platform.
Notes
- Our apologies to green/red colourblind readers. Initially we chose green/red for this because of their clear semantics. We'd like to provide more accessible versions of this for future iterations of this type of visualisation, without losing meaning.

Comments 0
The comments section is closed for articles published more than a year ago. If you'd like to inform us of any issues, please contact us.