Following on from the European Championship earlier this year, we looked at changes in Internet traffic volume at Internet Exchange Points (IXPs) during the Olympics. This is a joint project with Euro-IX.
Introduction
Now that the Paralympics 2012 are in full swing in London, it's a good time to look back at the Olympic Games that took place from 27 July - 12 August in London and attracted a huge global audience. Following on from the European Championship earlier this year (see below a list of related articles on RIPE Labs), we were curious to look at changes in Internet traffic volume at Internet Exchange Points (IXPs) during the Olympics . T his is a joint project with Euro-IX and a number of participating IXPs.
The main difference between Euro 2012 and the Olympics was that Euro 2012 had games at set times out of office hours in the RIPE NCC service region whereas the Olympics had events running all day, including during office hours. Although this makes it less obvious to find patterns in the traffic volumes, we still found some. See below some examples we picked out during the Games. Please note that all graphs show times in UTC.
RIPE Atlas and the Olympic Games
We know that we won't see traffic that is exchanged outside of the exchanges we have traffic level statistics for, either because it is exchanged at other IXPs or through private interconnects between networks. To get a feeling for the scale of this, we did an IPv4-traceroute to www.bbc.co.uk (which was a key website for the 2012 Olympics and has an open peering policy according to peeringdb) from 161 UK RIPE Atlas probes. For 28 probes, the traceroute went through the LONAP public peering LAN, while traces for 55 probes were going through LINX to get to the BBC website. This only looks at the RIPE Atlas probes located in the UK. It is unclear if or to what extent this is representative for end users in the UK. For other types of content and other countries this might look very different, but this gives a sense of what we measure when looking at IXP traffic levels. The higher the traffic levels between two networks, the more likely it is they would interconnect privately.
Some interesting events
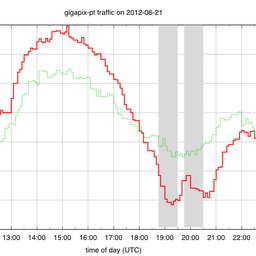
Opening Ceremony
First we looked at the opening ceremony that took place on Friday, 27 July 2012 to see if we observed any changes compared to other weeks. In the graph below, for instance, you can can see the traffic volume at LINX on Fridays. The dotted lines show the three weeks before the Olympics and the week after. The red line shows the Friday of the opening ceremony. The green and the blue line shows the traffic the two weeks after.
As you can see, the red line looks different from all the others: there is a clear drop in traffic just when the opening ceremony begins at around 20:00 UTC.

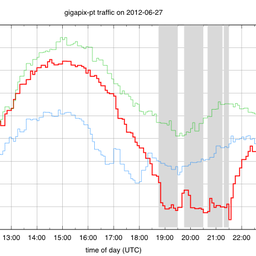
Cycling in the UK
According to The Guardian, Bradley Wiggins winning cycling gold on 1 August was the most watched video on the BBC sport site . Again, when looking at the traffic volume at LINX (see Figure 2), we see an uncharacteristic peak of traffic at around 15:00 UTC (red line), which is around the time the cycling event took place (and around the same time the BBC observed a peak).

Boxing in Ireland
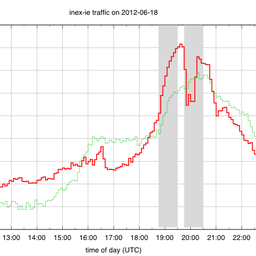
A popular event in Ireland was the ladies' boxing on 9 August when Katie Taylor from Ireland won a gold medal. The national broadcaster website in Ireland came down during the semi-final. The graphs from INEX show close similarity across her fights on 6, 8 and 9 August.
The graph below shows the traffic at INEX on Thursdays before, during and after the Olympics. The red line shows the traffic on Thursday, 2 August, and the rise in traffic at around 14:00 UTC coincides with Darren O'Neill from Ireland boxing against Stefan Hartel from Germany.
The green line shows the traffic on Thursday, 9 August, the day Katie Taylor won the gold medal in boxing. Before the boxing match we see a rise in traffic, followed by a steep drop at 16:00 UTC when the match starts.

Office hours vs. evening hours
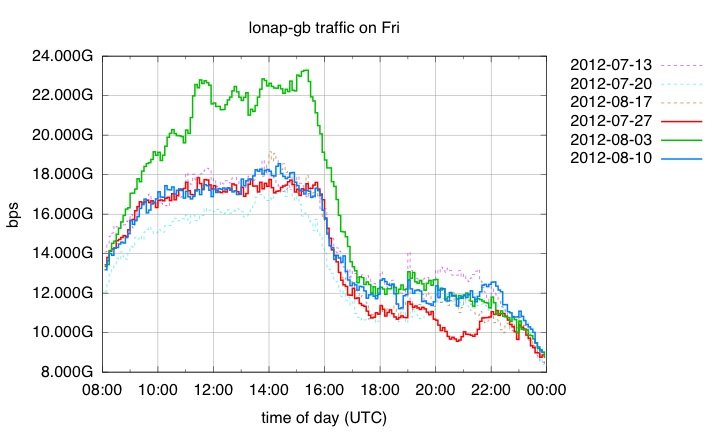
Because many events took place during office hours, in some cases we observed almost the opposite pattern of peaks and troughs that we saw in Euro 2012: instead of people going offline during matches they went online during popular events in office hours. As an example, see the increase in traffic volume at LONAP on Friday, 3 August during the day (green line). During this day, a number of events took place that were popular in the UK, such as the women's heptathlon featuring Jessica Ennis, the women's cycling with Victoria Pendleton and the men's tennis semi-final with Andy Murray.
This graph also shows nicely a drop in traffic volume during the opening ceremony in the evening of 27 July, which could show people leaving the Internet and switching on TV.

Figure 4: Traffic volume at LONAP on Fridays before, during and after the Olympics
100m men's final
The 100 men's final on Sunday, 5 August around 20:50 UTC was a widely watched event. Even though the signal is not very clear, the unusual drop in traffic volume as observed at ECIX in Germany during the evening could be attributed to this event (see the green line in Figure 5).

Peaks in Traffic at Russian IXPs
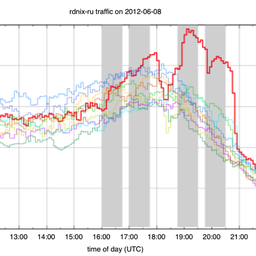
It is interesting to see that the IXPs in Rostov-on-Don and Samara, both located in Russia, which provided dramatic graphs during Euro 2012, did so again during the Olympic Games. See for instance the increase in traffic volume at the Samara IXP on Sunday, 12 August (blue line). Around 12:00 UTC Russia beat Argentina in the men's basketball semi-final. And just after that, Russia beat Brazil in the men's volleyball final.

A comparable peak can be observed at RDNIX (Rostov-on-Don).
Traffic in CDN-Cache in Italy
As a source of comparison we got traffic stats for a CDN-cache in Northern Italy. What we see here is an increase in traffic during the weeks of the 2012 Olympics. You can see this below in Figure 6 (starting mid week 30 and ending week 32).

Conclusion
Similar to the European Championships, some of the participating IXPs clearly show some different patterns during the Olympics compared to the weeks before. We would be curious to hear what you saw for your country. Were there any events that created interesting patterns in the traffic volume of your IXP?
All graphs are available on the RIPE NCC IXP Traffic page in a format that allows comparison of IXPs' data for each day and between IXPs. Note that we removed some known data irregularities that were caused by the data collection process, but we cannot guarantee that there are no other irregularities due to the way data was collected.
We observed some interesting patterns during the 2012 European Championships and the Summer Olympics, but maybe even more interesting is that although sporting events of this size sometimes totally swamp the public switched telephone network (PSTN) or mobile phone networks, none of these events showed any alarming Internet traffic trends at the Internet Exchanges. Perhaps this is a sign of the health of the current Internet ecosystem. The fact that it's easy to add or upgrade private interconnects, or capacity at an IXP, combined with using technologies like CDN that limit the amount of bandwidth needed across interdomain links, makes the collection of interconnected networks that we call the Internet handle situations like this quite well.
For an overview of all events, times and results during the Games, you can also see the Olympics Schedule And Results .
Participating IXPs with links to their statistics pages:


Comments 3
The comments section is closed for articles published more than a year ago. If you'd like to inform us of any issues, please contact us.
otmar •
I blogged about this effect two years ago: http://lendl.priv.at/blog/2010/06/25/the-effect-of-soccer-on-the-ixps/ On the Vienna exchange point, the live TV streams can make a significant change to the average traffic flow. There is a lot less baseline traffic compared to LINX and I also assume that the BBC is doing either private peerings with the big ISPs or has deployed a CDN into their network to reduce the network load. In Austria -- AFAIK -- our public broadcasting organization pushes all their data via the VIX. Combined with the lower baseline, this created nicely visible peaks. We'll see the same effect in the winter again: all the live-streams of alpine skiing events: They are popular in Austria and a good number of them are during business hours.
John Jason Brzozowski •
Is IPv4 versus IPv6 traffic available?
Emile Aben •
We do have IPv6 traffic level graphs available for one IXP (DECIX), these are available from the overview IXP traffic stats page, labeled 'decixv6fra-de' ( the link is: http://albatross.ripe.net/demo-area/ixp-olympics/ , also linked in the article above). We didn't do any specific analysis related to IPv6. If you find interesting traffic patterns in there, let us know!