1.0.0.0/8 has been assigned by IANA to APNIC on 19 January 2010, for use for as public unicast space for further address allocations and assignments. Before starting to allocate and assign from this range, APNIC has undertaken a study into 1.0.0.0/8.
Authors of this report are Geoff Huston and George Michaelson, APNIC. The report was originally published here: http://www.potaroo.net/studies/1slash8/1slash8.html
Background
The address plan for IPv4 has a reservation for “Private Use” address space. This reservation, comprising of 3 distinct address blocks, namely 10.0.0.0/8, 172.16.0.0/12 and 192.168.0.0/16, is intended for use in private contexts where the devices that are addressed in this manner do not have any requirement to be visible to the public Internet. However, it has long been recognised that other addresses have also been used in private contexts, Some of these uses are entirely informal and local, while other uses have been a little more systematic. One recent study of this form noted that the address block of network 1, or 1.0.0.0/8, was “ widely used as private address space in large organizations whose needs exceed those provided for by RFC 1918” [1].
1.0.0.0/8 has been assigned by IANA to APNIC on 19 January 2010, for use for as public unicast space for further address allocations and assignments. Before APNIC commences allocations and assignments, APNIC has undertaken a study into 1.0.0.0/8. The particular question under investigation here is the extent to which addresses in network 1.0.0.0/8 are an “attractor” for unwanted traffic. In particular, is there a significant level of “leakage” of supposedly private use traffic directed to addresses in 1.0.0.0/8 that “leak” into the public Internet?
While network 1.0.0.0/8 was an unallocated and unadvertised network any such traffic directed to an address in this block that “leaked” into the public Internet would follow a “default” routing path to the point where there was a “default-free” routing element, where the traffic would be discarded. As soon as any such address in 1.0.0.0/8 was advertised as reachable into the public Internet, instead of being discarded as the boundary of the default-free zone (DFZ), the packets would be passed onto the destination rather than being discarded.
On 27 January 2010 the RIPE NCC, in collaboration with APNIC, announced 4 prefixes in 1.0.0.0/8, namely 1.1.1.0/24, 1.2.3.0/24, 1.50.0.0/22 and 1.255.0.0/16. They noticed an immediate effect in terms of a jump in traffic to the announcement point that saturated the 10Mbps port (Figure 1) [2]. The announcements of 1.1.1.0/24 and 1.2.3.0/24 were dropped by the RIPE NCC on 2 February, and the announcements of 1.50.0.0/22 and 1.255.0.0/16 were dropped on 9 March 2010. The RIPE NCC performed some packet capture of the traffic being sent to these prefixes, and their results are described in [2].
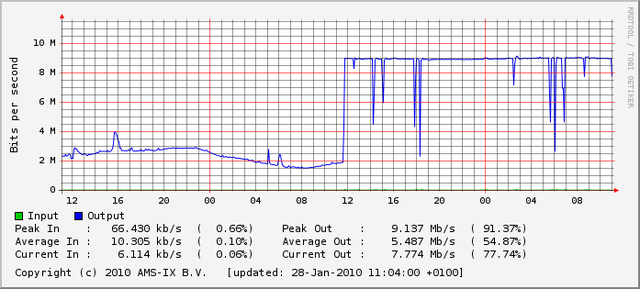
Figure 1 – Traffic load at the RIPE NCC announcement point of 1.0.0.0/8 more specifics [2].
APNIC Study
It appears that there is a significant amount of traffic that is being directed to addresses in network 1. This traffic is likely to be a combination of leakage of traffic from private use domains, potential “leakage” from mis-configured equipment and a certain amount of scanning activity. Following the work undertaken by the RIPE NCC, we commenced further investigation of the traffic in network 1 in February 2010.
The primary objective of this work was to quantify the extent to which networks in 1.0.0.0/8 attract “pollution” or “unwanted” traffic.
A related objective was to investigate the distribution of traffic directed to addresses in 1.0.0.0/8 to determine if there are particular addresses that are “hot spots” for attracting unwanted traffic, and quantify the additional traffic that such addresses attract.
It is also the intent to use this study to inform potential recipients of addresses in this address block of the anticipated profile of unwanted traffic that may be directed to such addresses.
In February 2010 we solicited assistance from potential collaborators to perform a comprehensive packet capture for the entirety of 1.0.0.0/8. Collaborative experiments have been undertaken with Merit and with YouTube as an outcome of this exercise, and this report summarizes the initial findings of these studies. We would like to acknowledge their assistance here, as their generous support and flexible responses to our requirements have been vital in assembling this report.
AS237 Announcement of 1.0.0.0/8
AS237 (Merit) announced network 1.0.0.0/8 from 22 February 2010 until 1 March 2010. A single system was used as the packet capture device and the configuration was entirely passive. The system did not respond to any packets that it received in 1.0.0.0/8. The system performed a full packet capture of all packets received.
The analysis reported here is based on the 6 day period from 0000 23 February 2010 UTC -6 through to 2400 28 February 2010 UTC -6.
Traffic Profile
Figure 2 shows the traffic received by the collection point for this 96 hour period on a second-by-second basis.
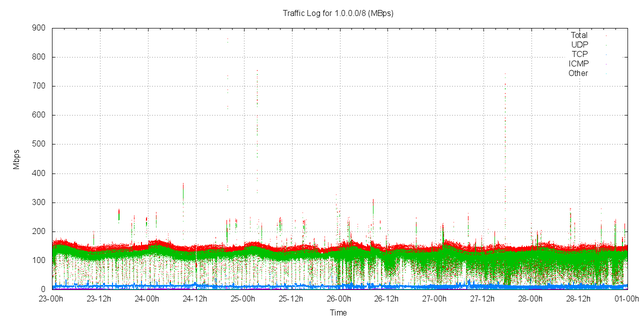
Figure 2 – Traffic received by AS237
The traffic logs show that the traffic sent to 1.0.0.0/8 is a relatively steady 160Mbps for the period. There is a slight element of a 24 hour diurnal cycle in the data, but it is not a pronounced cycle in terms of total received traffic levels.
There is a regular interval of reduced traffic in these logs, evidently corresponding to the file cycle interval for the packet capture system. Other incidents of short term reduced traffic incidents to be based around packet loss by the packet capture system.
There are short bursts of between 1 and 30 seconds of elevated traffic levels There are 20 or so incidents of burst traffic levels of between 200Mbps and 300Mbps. There is a 3 second isolated burst at 860Mbps and a 10 second burst at 750Mbps in this period.
The profile of traffic in each protocol is shown in the following collection of figures.
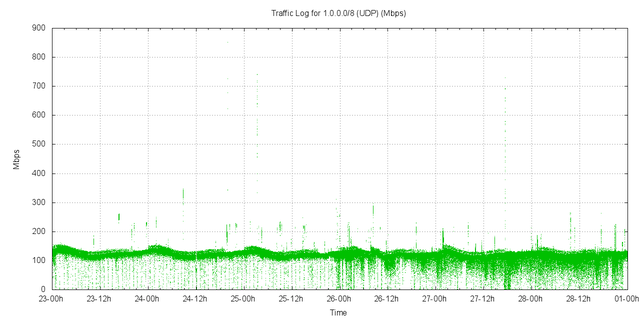
Figure 3 – UDP Traffic received by AS237
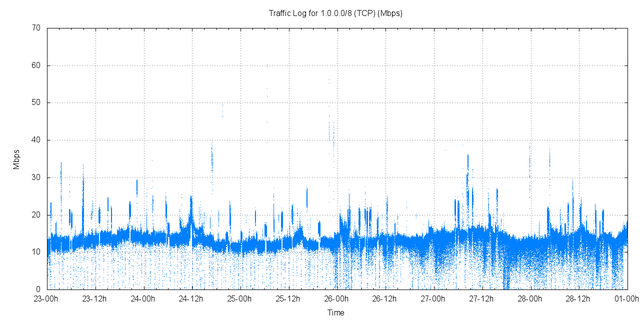
Figure 4 – TCP Traffic received by AS237
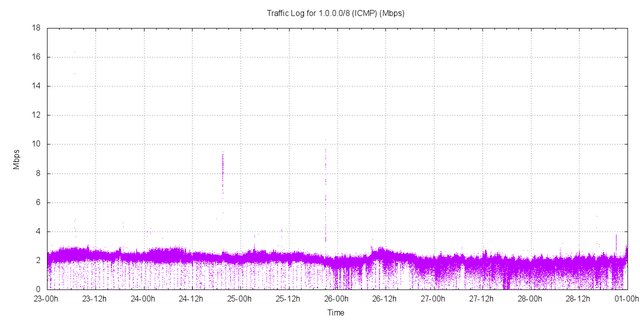
Figure 5 – ICMP Traffic received by AS237
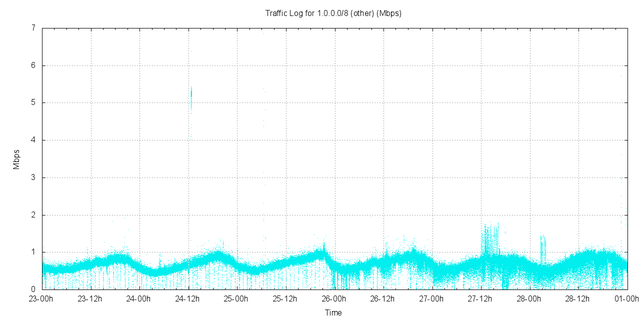
Figure 6 – Other Traffic received by AS237
Packet Profile
Figure 7 shows the received packet rate for the period. Of note is the pronounced diurnal pattern in the data, particularly in the UDP data. The peaks are not as pronounced, indicating that the peaks in traffic rate are due to a burst of larger UDP packets.
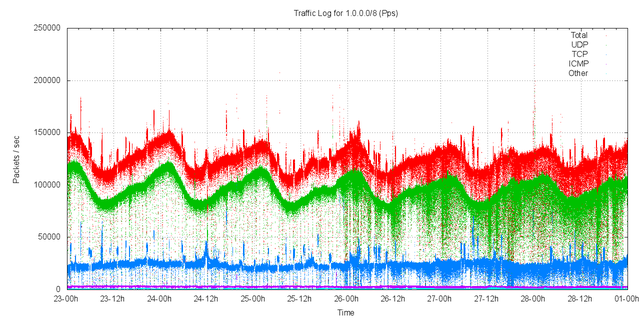
Figure 7 – Received Packet rate
In terms of protocol distribution as measured by bytes of traffic the distribution according to protocol is shown in Table I.
| Protocol | Proportion of Traffic | Proportion of Packets |
| UDP | 88.1% | 76.9% |
| TCP | 9.8% | 19.8% |
| ICMP | 1.6% | 2.5% |
| Other | 0.5% | 0.7% |
Table I – Distribution of traffic by Protocol
The distribution of packet sizes by protocol is shown in Figure 8. TCP packet sizes were consistently in the range 69-70 bytes, indicative of a TCP SYN packet header of 16 bytes of framing, 20 of IP, 20 of TCP, and 13-14 bytes of TCP options.
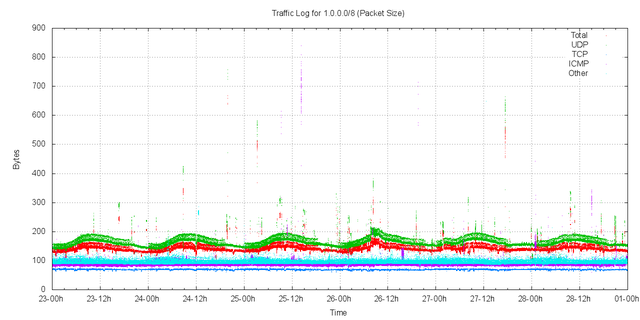
Figure 8 – Distribution of Packet Sizes by Protocol
Distribution of Traffic across Network 1 - /16s
The traffic in network 1 is not evenly distributed across all destinations. Figure 9 shows the distribution of traffic within 1/8 divided up into address blocks of a /16 in size. Note that this is a log scale of traffic levels, and the levels reported here are an average for the entire collection period.
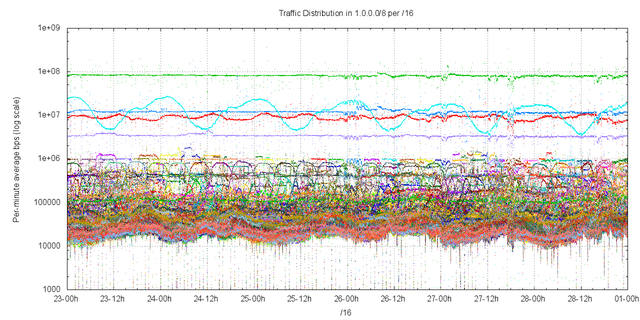
Figure 9 – Traffic levels per /16
Figure 10 provides an average of the traffic across the 6 day period. The figure shows both the average level of traffic and the peak 60 level of traffic for each /16. The RIPE NCC advertisements of
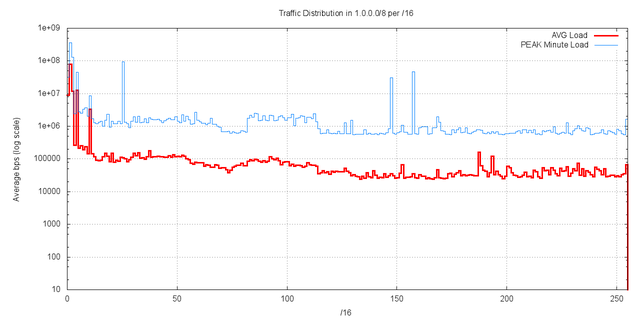
Figure 10 – Traffic levels per /16
A similar picture can be drawn of the incoming packet rate to the /16s in network 1. It appears from a comparison of the two data series that the elevated traffic levels in the low numbered address block are due to certain addresses receiving larger packets, as distinct from simply seeing elevated traffic volumes.
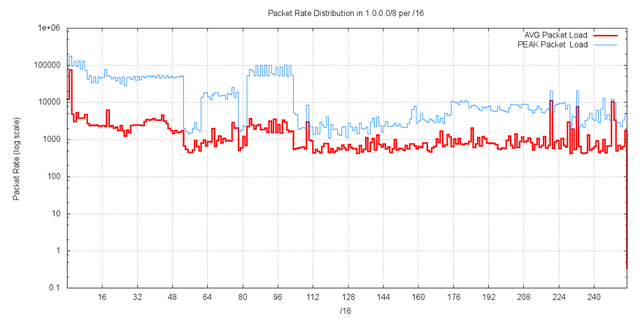
Figure 11 – Packet levels per /16
It appears that from this data there are significantly higher traffic levels sent to addresses in 1.0.0.0/16, 1.1.0.0/16, 1.2.0.0/16.
Those /16s with an average traffic level of more than 150Kbps for the 6 day period are listed here in Table II.
| /16 Address Prefix | Average Traffic | 60 second peak |
| 1.1.0.0/16 | 79,981 kbps | 353,839 kbps |
| 1.4.0.0/16 | 12,564 kbps | 45,752 kbps |
| 1.2.0.0/16 | 12,010 kbps | 127,997 kbps |
| 1.0.0.0/16 | 8,816 kbps | 32,038 kbps |
| 1.10.0.0/16 | 3,320 kbps | 8,668 kbps |
| 1.3.0.0/16 | 261 kbps | 2,388 kbps |
| 1.6.0.0/16 | 258 kbps | 2,519 kbps |
| 1.8.0.0/16 | 238 kbps | 3,650 kbps |
| 1.5.0.0/16 | 212 kbps | 2,816 kbps |
| 1.7.0.0/16 | 188 kbps | 3,351 kbps |
| 1.37.0.0/16 | 176 kbps | 1,805 kbps |
| 1.187.0.0/16 | 160 kbps | 788 kbps |
| 1.32.0.0/16 | 153 kbps | 2012 kbps |
| 1.20.0.0/16 | 151 kbps | 1429 kbps |
Table II – Distribution of traffic by /16s
A “Control Point” Measurement
Is this level of traffic being passed into network 1.0.0.0/8 “normal”? What’s a “normal” expectation in terms of traffic?
To provide answer to this question we advertised a smaller prefix, namely 27.128.0.0/12, under similar conditions to the advertisement of 1.0.0.0/8. This prefix was drawn from the unallocated address pool managed by APNIC. This advertisement of this address block was undertaken in collaboration with
YouTube, and 27.128.0.0/12 was advertised by AS36351 on 19 March 2010. The traffic levels attracted by this advertisement was collected by 4 passive collectors in a load-sharing configuration. The aggregate traffic levels, per /16 is shown for the 24 hour period. It is evident that there is a distinct correlation across the /16s of an average traffic level of 10Kbps. This is shown in Figure 13.
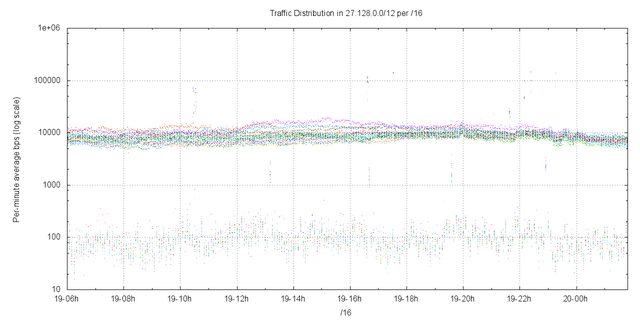
Figure 12 – 27.128.0.0/12 traffic levels per /16
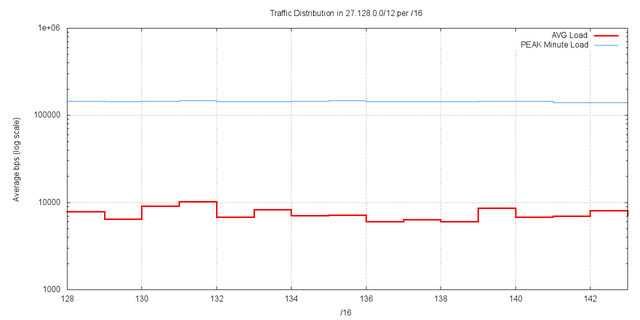
Figure 13 – 27.128.0.0/12 average traffic levels per /16
Distribution of Traffic by /24s
A similar analysis can be performed at the granularity of /24s. Figure 14 shows the profile of traffic to each /24 in the address block 1.1.0.0/16.
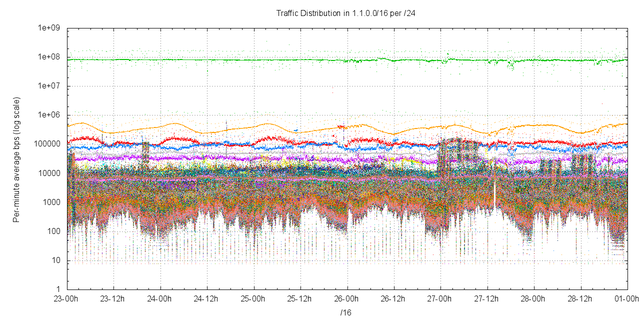
Figure 14 – Traffic levels per /24 in 1.1.0.0/16
One /24 within this address block dominates all others, namely 1.1.1.0/24. The traffic profile for this particular /24 is shown in Figure 15. There is a steady load of between 80 to 100Mbps of traffic directed to this prefix. With the predominate volume being directed to the single address 1.1.1.1.
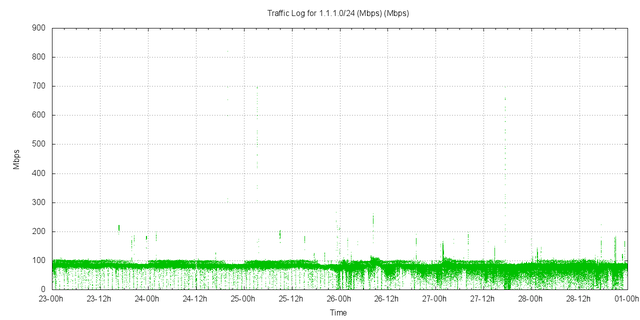
Figure 15 – Traffic levels for 1.1.1.0/24
In order to provide an overview of the traffic sent into each of the /24s in 1.0.0.0/8, Figure 16 shows the distribution of traffic levels by number of /24s. divided into “bins” of 50bps increments. Together with a cumulative count.
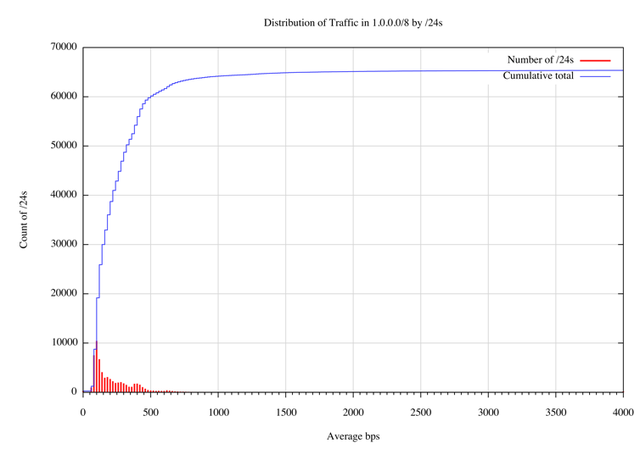
Figure 16 – Distribution of traffic in 1.0.0.0/8 per /24
The distribution has some similarity to an exponential decay function (which would be the case if the log of the distribution was linear). Figure 17 shows the same data presented using a log scale for the count of /24’s in each average traffic level bin.
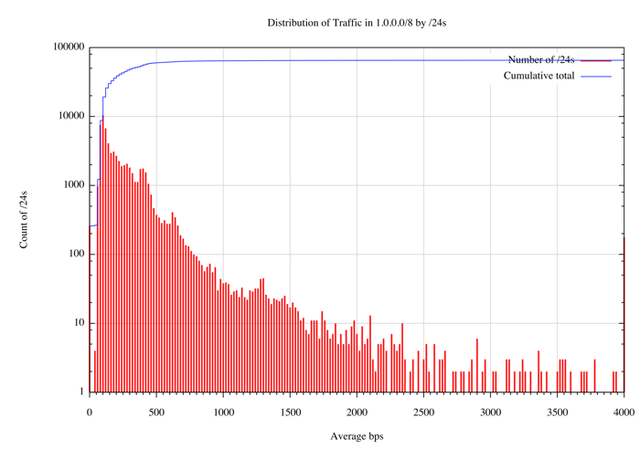
Figure 17 – Distribution of traffic in 1.0.0.0/8 per /24 (log scale)
In this distribution 98% of the /24s, or 64,252 /24s received an average traffic load less than 132 bytes per second (or an average of 1 packets per second). The following table shows the distribution of /24s by average packet rates, using an average packet size of 132 bytes (as measured in the packet capture for 1.0.0.0/8).
| Average Pkt per sec. | Average bps | Number of /24s | Cumulative Total | % of total |
| <= 1 | <= 1056bps | 64252 | 64252 | 98.0% |
| 1 .. 2 | <= 2112bps | 916 | 65168 | 99.4% |
| 2 .. 3 | <= 3168bps | 195 | 65303 | 99.6% |
| >= 3 | > 3168bps | 233 | 65536 | 100% |
Table III – Distribution of traffic by /24s
Control Point Comparison
A similar exercise has been undertaken for traffic in 27.128.0.0/12. The distribution of traffic per /24 is shown in Figures 18 and 19.
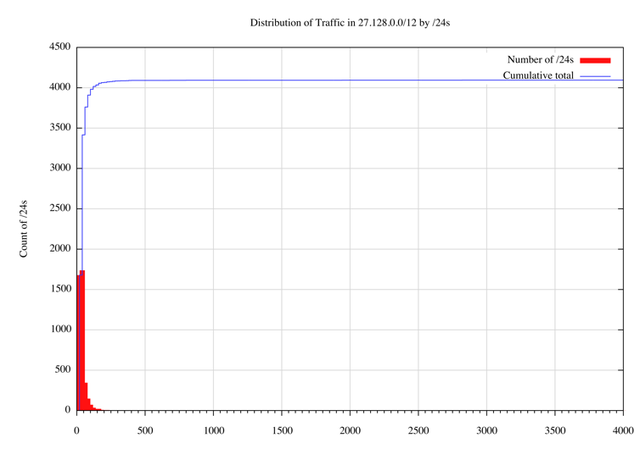
Figure 18 – Distribution of traffic in 27.128.0.0/12 per /24
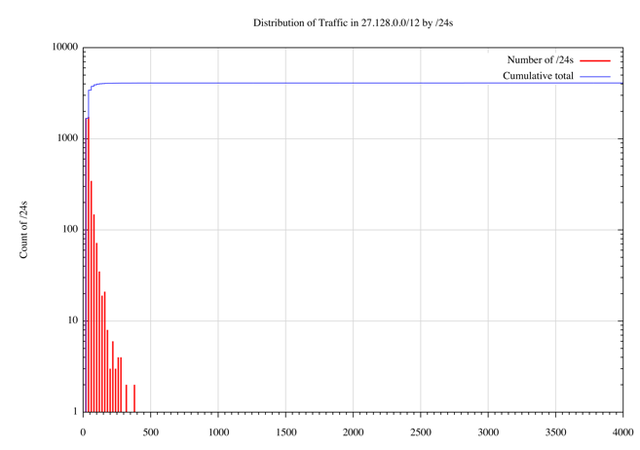
Figure 19 – Distribution of traffic in 27.128.0.0/24 per /24 (log scale)
| Average Pkt per sec. | Average bps | Number of /24s | Cumulative Total | % of total |
| <= 1 | <= 776bps | 4092 | 4092 | 99.9% |
| 1 .. 2 | <= 1552bps | 1 | 4093 | 99.9% |
| 2 .. 3 | <= 2328bps | 1 | 4094 | 99.9% |
| 3 .. 4 | <= 3104bps | 1 | 4095 | 99.9% |
| >= 3 | > 3104bps | 1 | 4096 | 100% |
Table IV – Distribution of traffic by /24s in 27.128.0.0/12
In this case 4087 /24s (or 99.8% of the /24s) received less than 258 bits per second, or the equivalent of 1 packet every 3 seconds (the average packet size for the 27.128.0.0/12 packet capture was 97 bytes)
Correlation of the Data
The experiment of passive listening of incoming packets addressed to network 1.0.0.0/8 was repeated for a further 4 hours on 21 March 2010. This was undertaken by YouTube, and the prefix was originated by AS36351, with incoming traffic collected using four systems and a load balancing front end. The profile of traffic gathered in this interval is shown in Figure 20. (The data anomaly at 22:40 was the result of the restarting of the packet collection system on one of the four data collection systems.)
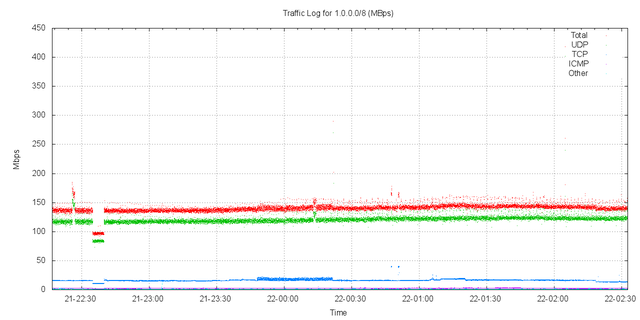
Figure 20 - 1.0.0.0/8 traffic to AS36351
The profile of traffic for this 6 hour period is comparable to the profile of the original AS237 announcement. The traffic level is some 150Mbps. With the predominate volume comprising of UDP packets. The measurement of traffic in the busiest /24, 1.1.1.0/24, is similar to the profile gathered in AS237, shown in Figure 21.
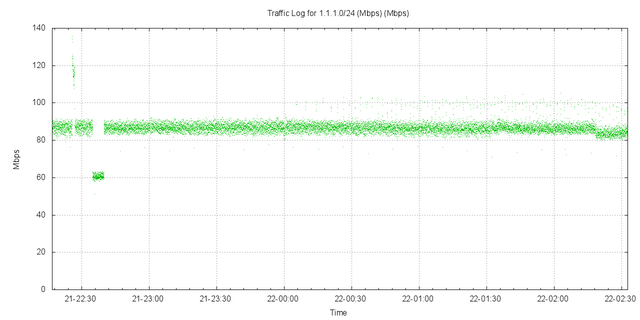
Figure 21 - 1.1.1.0/24 traffic to AS36351
The profile of traffic distribution per /16 is shown in Figure 22. Compared to Figure 9, there is a comparable traffic pattern, with 5 /16’s showing incoming traffic levels higher than 1Mbps, and all other /16s showing traffic levels of less than 100Kbps (Figure 23).
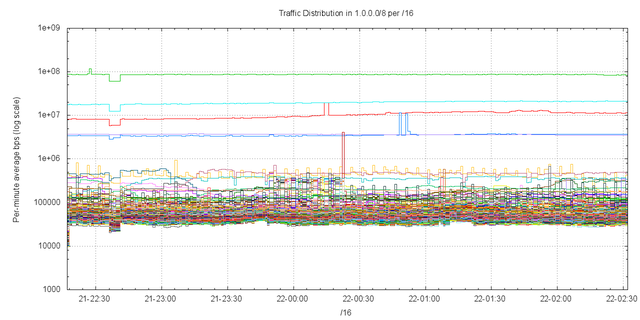
Figure 22 – Traffic levels per /16 – AS35361
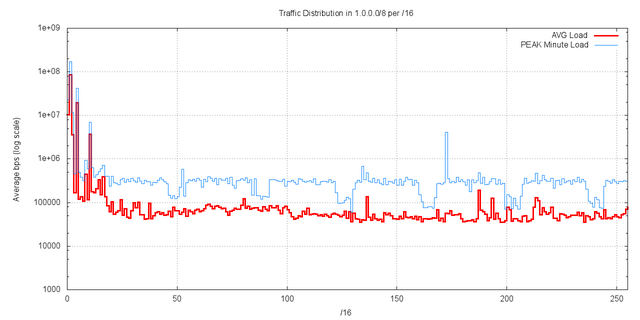
Figure 23 – Traffic levels per /16 – AS35361
Those /16s with average traffic of more than 150Kbps for the period are listed in Table V.
| /16 Address Prefix |
Average Traffic (AS35361) |
Average Traffic (AS237) |
| 1.1.0.0/16 | 86,757 kbps | 79,981 kbps |
| 1.4.0.0/16 | 19,714 kbps | 12,564 kbps |
| 1.0.0.0/16 | 10,241 kbps | 8,816 kbps |
| 1.10.0.0/16 | 3,656 kbps | 3,320 kbps |
| 1.2.0.0/16 | 3,611 kbps | 12,010 kbps |
| 1.8.0.0/16 | 452 kbps | 238 kbps |
| 1.16.0.0/16 | 390 kbps | 115 kbps |
| 1.14.0.0/16 | 337 kbps | 87 kbps |
| 1.13.0.0/16 | 206 kbps | 92 kbps |
| 1.187.0.0/16 | 192 kbps | 160 kbps |
| 1.11.0.0/16 | 178 kbps | 145 kbps |
| 1.12.0.0/16 | 169 kbps | 117 kbps |
| 1.3.0.0/16 | 168 kbps | 261 kbps |
| 1.15.0.0/16 | 151 kbps | 92 kbps |
Table V – Distribution of traffic by /16s - /16s with > 150kbps measured by AS36351
A comparison of the /16s with average traffic levels of more than 150kbps as measured in the extended AS237 experiment with average traffic level measured in the shorter AS35361 experiment is shown in Table VI. The set of the 5 highest /16s (1.0.0.0/16, 1.1.0.0/16,1.2.0.0/16. 1.4.0.0/16 and 1.10.0.0/16) are common to both data sets. Of the remainder, 1.3.0.0/16 and 1.187.0.0/16 are common.
| /16 Address Prefix |
Average Traffic (AS237) |
Average Traffic (AS35361) |
| 1.1.0.0/16 | 79,981 kbps | 86,757 kbps |
| 1.4.0.0/16 | 12,564 kbps | 19,714 kbps |
| 1.2.0.0/16 | 12,010 kbps | 3,611 kbps |
| 1.0.0.0/16 | 8,816 kbps | 10,241 kbps |
| 1.10.0.0/16 | 3,320 kbps | 3,656 kbps |
| 1.3.0.0/16 | 261 kbps | 168 kbps |
| 1.6.0.0/16 | 258 kbps | 143 kbps |
| 1.8.0.0/16 | 238 kbps | 453 kbps |
| 1.5.0.0/16 | 212 kbps | 118 kbps |
| 1.7.0.0/16 | 188 kbps | 106 kbps |
| 1.37.0.0/16 | 176 kbps | 96 kbps |
| 1.187.0.0/16 | 160 kbps | 192 kbps |
| 1.32.0.0/16 | 153 kbps | 100 kbps |
| 1.20.0.0/16 | 151 kbps | 105 kbps |
Table VI – Distribution of traffic by /16s – comparison of AS237 and AS36351 /16s
A comparison of the two data sets is shown in Figure 24.
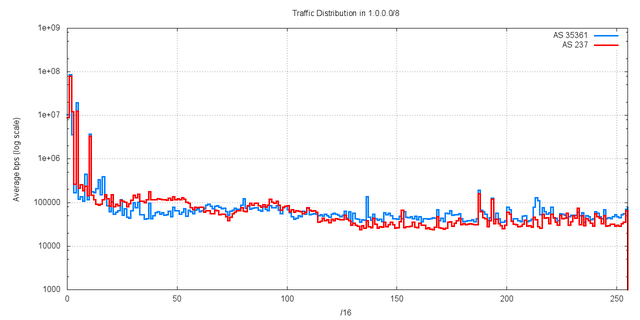
Figure 24 – Traffic levels per /16 – Comparison of AS237 with AS35361
The data from this second data collection experiment correlates well with the extended data set gathered from AS237. There is a good correlation between the two data sets for the overall majority of the traffic. Of the 150Mbps of the incoming traffic directed to 1.0.0.0/8, 122bps, or some 80% of the traffic is directed to addresses in 5 of these /16s, namely 1.0.0.0/16, , 1.1.0.0/16,1.2.0.0/16. 1.4.0.0/16 and 1.10.0.0/16. There is not as close correlation with traffic levels in the other /16s. This could be due to the short time period of the AS35361 experiment (4 hours) compared with the 6 day AS237 data collection experiment, with the consequent limitation that the AS35361 data was not exposed to a complete 24 hour traffic cycle.
Traffic Directed to 1.0.0.0/8
Network 1.0.0.0/8 currently attracts an average of some 140Mbps - 160Mbps of incoming traffic, as a continuous sustained traffic level.
Traffic appears to be a combination of scans that pass across part or the entirety of the addresses in this block and streams of UDP traffic addresses to particular individual addresses in the block.
The traffic in 1.0.0.0/8 is not evenly distributed. The majority of the traffic is directed at 1.1.1.1, and the covering /24, 1.1.1.0/24 receives some 90 – 100Mbps of traffic as a continuous load, with isolated peaks of 1 second intervals in excess of 800Mbps.
Using a control point of 27.128.0.0/12 to establish a “normal” background traffic level, it appears that 90% of the /24s in 1.0.0.0/8 receive less than 1 average packet per second of incoming traffic (the 90% percentile value of the traffic distribution per /24 is at the level of 1 average sized packet every 3 seconds).
No /24 in 1.0.0.0/8 has an average traffic level that is less than the average /24 load observed in 27.128.0.0/12.
Using a benchmark threshold level of 1 average-sized packet per second, or 1.056 Kbps, 98.8% of all /24s in 1.0.0.0/8 receive less than this threshold, and 1,344 /24s that receive a higher rate.
There are 428 /24s that receive more than 2.112kbps of incoming traffic, or more than 2 average-sized packets per second.
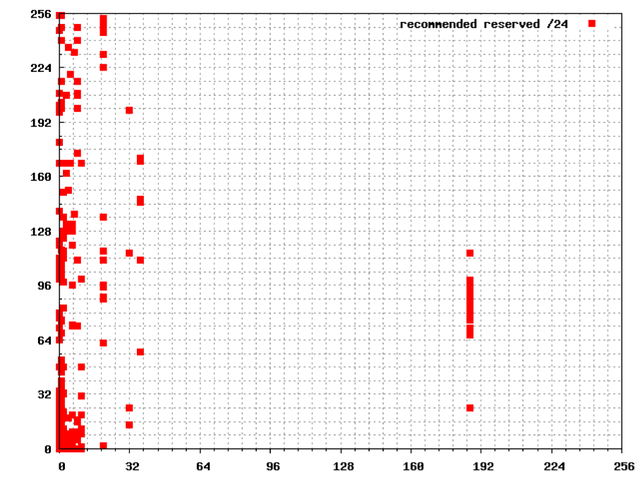
There are 233 /24s that receive more than 3,168kbps of incoming traffic, or more than 3 average-sized packets per second. These /24s are located within 14 /16s within 1.0.0.0/8. This list of /24s that received in excess of 3 average-sized packets per second, and their enclosing /16s, are provided in Appendix I of this report.
Recommendations
-
It is recommended that the following /24s be withheld from general allocation by APNIC, on the basis that each of these /24s individual attract more than 1 Mbps of unsolicited traffic:
1.0.0.0/24 8Mbps
1.1.1.0/24 79 Mbps
1.2.3.0/24 11 Mbps
1.4.0.0/24 12 Mbps
1.10.10.0/24 3 MbpsThese /24s should be marked as allocated to APNIC R&D to allow further experimentation in the long term nature of unsolicited background traffic to be conducted by APNIC in collaboration with interested researchers and the operational community.
If further investigation reveals that the traffic to any of these /24s abates to a normal background level in the future, or if there is a viable form of mediation that makes any of these network prefixes useable in a general fashion on the public Internet, then these addresses would be returned to the APNIC unallocated address pool at that time.
It is recommended that the following /16s be temporarily marked as reserved and withheld from general allocation by APNIC:
1.0.0.0/16
1.1.0.0/16
1.2.0.0/16
1.3.0.0/16
1.4.0.0/16
1.5.0.0/16
1.6.0.0/16
1.7.0.0/16
1.8.0.0/16
1.10.0.0/16
1.20.0.0/16
1.32.0.0/16
1.37.0.0/16
1.187.0.0/16
These /16s should be marked as allocated to APNIC R&D to allow further short term experimentation in the distribution of unsolicited background traffic to these addresses to be conducted by APNIC in collaboration with interested researchers and the operational community. The experimentation would be conducted in the period April – October 2010, and a followup report on recommended longer term reservations from this set of addresses be provided at the end of this period.
Acknowledgements
This work has benefited greatly from the generous assistance from our collaborators in this exercise. We wish to thank the folk from the RIPE NCC, Merit, AARNet, YouTube and Google for both their patience and enthusiasm to provide us with the necessary facilities to undertake this work. Particular thanks are due to Nathan Hickson of YouTube and Steve Padgett of Google for their generous assistance.
References
[1] Leo Vegoda, “Awkward /8 Assignments”, Internet Protocol Journal, September 2007. ( http://www.cisco.com/web/about/ac123/ac147/archived_issues/ipj_10-3/103_awkward.html )
[2] “Pollution in 1/8”, RIPE Labs Report, RIPE NCC, 3 February 2010. ( http://labs.ripe.net/content/pollution-18 )
Appendix I
Top 233 /24s – Ordered by Address
The following is a “map” of the /24s in 1.0.0.0/8 with the nominated high traffic points of more than 3 packets per second per /24 highlighted.
Authors of this report are Geoff Huston and George Michaelson, APNIC. The report has originally be published here: http://www.potaroo.net/studies/1slash8/1slash8.html


Comments 0
Comments are disabled on articles published more than a year ago. If you'd like to inform us of any issues, please reach out to us via the contact form here.