Following up from measurements done in February 2009 just after 1/8 had been allocated to APNIC, we looked at the data again and made some additional observations.
At the start of February 2010, we published some analysis on traffic received by our measurement nodes when we announced some segments of 1/8 on behalf of APNIC. This analysis didn't include data about the source IP addresses for the received traffic. I looked at the data again when composing some slides for the APRICOT 2010 conference.
We observed the following:
- 96,160 unique IP addresses
- 95% of them sent <= 10 packets
- 33% sent 1 packet
- 30% of all packets came from 23 IP addresses
-
4.4% from just 1 IP address
-
- 90% came from 43 different /8s
- 15% claims to originate from 10/8
I was interested to see if there was any pattern in the sources of this traffic - was it all old legacy configurations, or largely from newer blocks, for example. I plotted the numbers on some graphs to look at this.
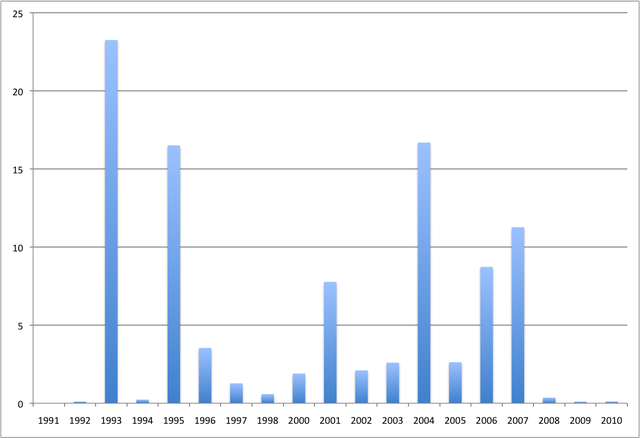
Figure 1 shows the percentage distribution of source /8s, based on the year that the range was allocated by the IANA.
- There's a big spike in 1993, but this relates to some cleanup work done in the source data.
- Ranges allocated in the past 2-3 years don't feature highly, but this is probably because many addresses from those ranges aren't yet active.
- There are spikes in 2001 and 2004, but no obvious reason why (the IANA didn't allocate unusually large numbers of /8s in these years)

Figure 1: The percentage distribution of source /8s
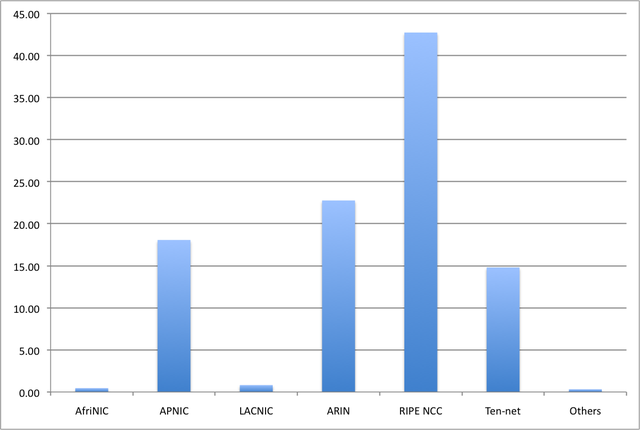
Next, I wondered if there might be some regional influence on the traffic, so I plotted the percentage of source /8s alongside their parent RIR (see Figure 2).
- AfriNIC and LACNIC don't register high, but they are the youngest RIRs and hold just 7% of the /8s allocated to RIRs.
- RIPE NCC is the highest - this is likely because our probe is in Europe and therefore caught more European traffic.
- Others in the chart refers to legacy /8s allocated to private organisations.

Figure 2: Regional influence on the traffic
In summary, there is no clear distribution trend in the sources of traffic to 1/8. What's interesting is that such a large portion of the traffic came from a very small number of IP addresses - attempting to contact those hosts could play a significant part in cleaning this address space. If you can see any trend or correlation that we missed, please comment in the forums.


Comments 0
The comments section is closed for articles published more than a year ago. If you'd like to inform us of any issues, please contact us.