
Over the past few months, the RIPE Atlas team and our stakeholders have been hard at work reimagining the probe detail pages to make them cleaner, more user-friendly, and enriched with new features.
The RIPE Atlas UI has been overhauled in many important ways in the last couple of years, most notably with last year's rollout of simplified navigation, dashboard, and new listing and measurement detail interfaces. Now, we're releasing the latest major rewrite of the interface, this time for the probe detail pages.
Like the measurement detail pages before them, we worked closely with stakeholders to retain useful features from the previous version while introducing improvements and new functionality. Our goal was not just to refine the layout for a better user experience, but also to offer probe hosts and users a clearer view of "how the Internet is seen" by specific probes. These updates should make interacting with your probe more insightful and meaningful than ever.
Overview
The first panel one lands on is the overview. This page contains probe information tailored to your relationship to the probe. If you are the probe's owner, you will see more information, for example, and be able to edit that information. In addition to the basic information, we have added a new interactive chart for traffic, links to a filtered list of all measurements running on this probe, and cards that show an overview of the probe's connectivity to some well-known targets. Finally, at the bottom of this page is the probe's uptime history and an events log that can be revealed to view important debugging information.

Network
Next up is the network panel, which retains most of the same information as the previous version, but cleans up the presentation and makes editing the probe's network settings simpler and easier. These items are:
- IPv4 and IPv6 Configurations
- Probe Address Discovery
- Connection History and Download
Results
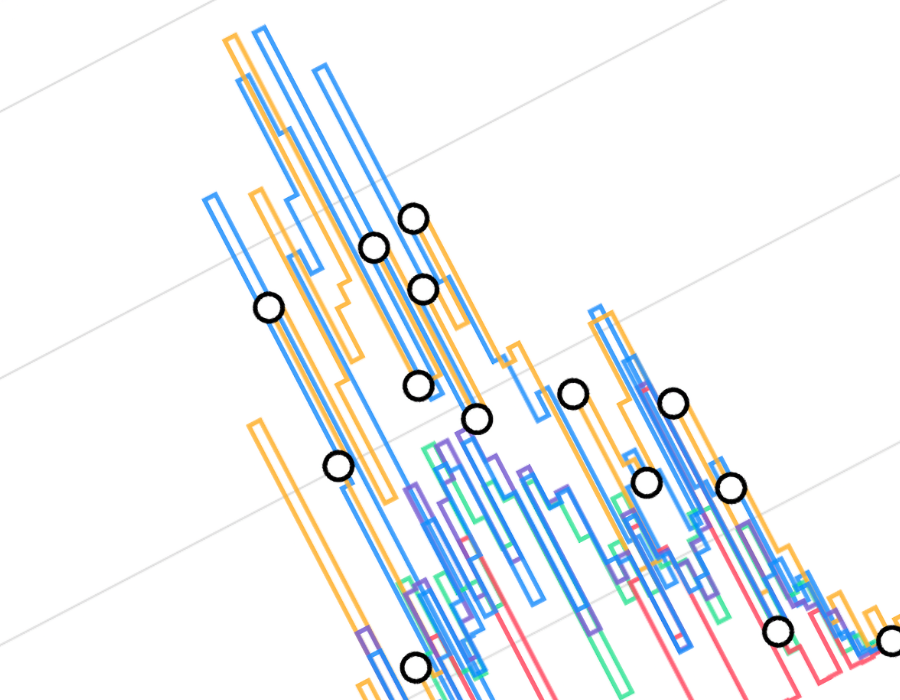
The Results panel is the most significant rework of the group. It replaces the former built-ins tabs, but gives you a much greater degree of control and analysis than was previously possible. Currently we have tabs for visualising in detail the previously mentioned "well-known" targets, as well as for analysing v4 and v6 built-in measurements. The graphs show ping activity and make it easy to compare multiple data series. Clicking on any point in a series allows users to access the nearest two traceroutes on either side for further analysis. Series labels are clickable, enabling users to show or hide preferred measurements, and there are also toggles to show/hide packet loss events, and to scale the y-axis for data clarity.
This is just the beginning of enhancements for the Results panel. In the future we will be showing even more of the probe's measurements and allowing greater customisation of these visualisations.

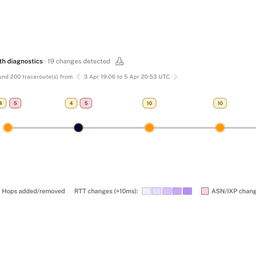
Let's look at a particular example where the latency graph shows a sudden change in RTT. We can find that point on the graph and click, to reveal:

Manage
The Manage panel is visible only to the probe’s owner (or those with shared management rights) and consolidates management functions relevant to the specific probe. These can be any of:
- Management Sharing
- Notifications Settings
- Transfer Ownership
- SSH Key
- Write off
Anchor
All information related to anchor functioning is now separated on its own panel, and users will only see this panel if the probe is also an anchor. This panel contains:
- Anchor info
- Host and Sponsor logos and links
- Mesh measurements
- Probe measurements
- Change History
What's Next?
We plan to continue improving RIPE Atlas by introducing new features and making data insights more accessible. In future iterations, we aim to explore ways to extend the service with views that help identify correlated probe behaviour. Stay tuned!
Please take a look at what we have done so far and let us know what you think. We welcome your feedback and suggestions for improving RIPE Atlas.
We are also looking for participants for user research or beta testing of RIPE Atlas and other RIPE NCC services. If you're interested please take a look at our information about user research and how to sign up.
Comments 0
The comments section is closed for articles published more than a year ago. If you'd like to inform us of any issues, please contact us.