
In the course of 2015 we have expanded the K-root anycast cluster with 17 hosted servers in 15 new cities. We look at RIPE Atlas to see what impact this had on performance on both global and regional scales.
Introduction
In a previous article called Update on K-root Expansion we discussed the expansion of the K-root server cluster. We saw preliminary signs of improved performance, in the form of lower round trip times (RTTs) from RIPE Atlas probes in Russia, Eastern Europe and the Middle East. In this article we take a closer look. In addition, we analyse statistics from the different K-root nodes each of the RIPE Atlas probes reached when performing queries to k.root-servers.net. For this we look at results from built-in RIPE Atlas measurement #10301 , which returns the RTT of the query as well as the ID of the DNS server that answered. In the next sections we discuss what we observe with RIPE Atlas both on a worldwide scale and on a regional scale, in Western Europe, Eastern Europe, Russia and CIS states, and the Middle East.
Worldwide view
To assess the overall impact of the K-root expansion, we first group the servers into two classes: those at existing locations and those at new locations, added in the last seven months. Figure 1 shows the evolution of new server uptake by the RIPE Atlas probes between 1 March 2015 and 1 November 2015. For each day in this time frame the blue and green markers represent the percentage of queries answered by an existing or new server respectively. Because the number of probes and thus the number of queries is increasing steadily, the results are normalised, presented as percentages of a daily total.
We can see in Figure 1 that from April onwards the relative number of queries reaching a new K-root server starts to increase as the new nodes are deployed. The first two weeks of August in particular show a significant rise in the percentage of queries reaching a new server. The locations in which servers were installed in that period turned out to be favourable for a sizable portion of the probes. On 1 November 2015 roughly 22% of the queries conducted as part of the built-in RIPE Atlas measurement reached a new server.

Figure 1 also shows (in brown) the percentages of queries for which the RIPE Atlas probe did not receive a proper reply: the query either timed out or the response was malformed. Finally, the violet markers indicate the percentage of queries that were answered by DNS servers which by the returned identification string clearly were recognised to not be part of the K-root anycast cluster.
In Figure 2 we take a more detailed look at which server in which location answered the queries. For each of the 35 weeks between 1 March and 1 November it shows a stack of percentages of queries answered by K-root server(s) in each location in that week. Although some cities host more than one server, we do not drill down to that level of detail, to keep the number of categories and thus the number of colours in the graph within limits.

As could be expected, the global nodes in Amsterdam, Frankfurt and London end up being selected most of the time. Of the new servers, the nodes in Vienna and Saint Petersburg are those used most often.
Next we look at the median RTTs for each day for each probe. This is a good metric to evaluate the impact on performance: do probes that switched to use a new server receive an answer in a shorter time or not? In Figure 3 we plot the median RTTs from all probes observed in the last seven months. The blue points represent results from the existing K-root servers and the green points show results where query replies came from servers in the new locations.

Because of the large number of results, from thousands of probes over 245 days, most of the detail is lost: the green points in the foreground mask blue points with similar RTTs in the background. However, the general trend is still clear. RTTs to new server locations tend to be lower and the group of results includes fewer cases of extremely high RTTs (such as satellite connections) than results involving the existing K-root servers.
For a more thorough, quantitative evaluation of performance we look at results from the subset of RIPE Atlas probes that was active both in March and in October 2015. Figure 4 shows the distribution of query RTTs in both months. The light blue histogram represents the distribution of RTTs as recorded by the probes in March, before the expansion started. The green and magenta histograms represent results from October. The first shows the distribution for queries that reached an existing server, while the second shows the results for queries answered by a new server. We can see that on a global scale, the new servers provide an overall improvement. The RTT distribution is more narrow and has shifted to lower values compared to results from the old servers, both in March and October.

Figure 4: Distribution of Median RTTs from RIPE Atlas probes active in both March and October.
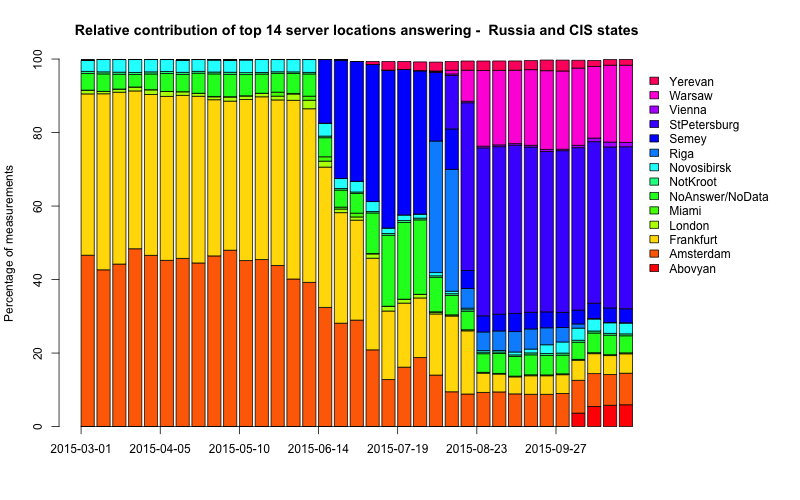
Russian Federation and CIS
With new K-root locations in Armenia, Kazakhstan, Latvia, Poland and the Russian Federation we hoped to improve the performance of the K-root system in the central and eastern parts of our service area. Results from the RIPE Atlas probes confirm the new servers are indeed much preferred in the region. As Figure 5 shows, when the servers in new locations came online, they immediately took over part of the load from other servers: both those in old locations as well as earlier deployed systems in new locations. For example, when the K-root server in Riga became active, it attracted part of the queries that were first answered by the new server in Semey, Kazakhstan. But Riga's share dropped again a few weeks later when the node in Saint Petersburg joined the cluster. By 1 November we see around 80% of the queries from probes in Russia and CIS states answered by the new servers.

The wide take-up in combination with shorter geographical distances also translates to an increase in performance. The comparison of RTT distributions from March and October in Figure 6 clearly shows how the RTTs to K-root have gone down in this region.

Eastern Europe
In Eastern Europe the uptake of new server locations is good too, though not as universal as in Russia and the CIS states. Figure 7 shows the probes in the region are roughly split in half between reaching a new location vs an existing location with their queries to K-root. From the new locations, Vienna is seen most often by RIPE Atlas probes in Eastern Europe. It may be just outside the geographical region, but for most probes in the region it is still much closer than Frankfurt, the location that previously dominated.

The RTTs are coming down too, as we can see in Figure 8. The bands around 300ms and 180ms are from queries that reached the K-root nodes in Tokyo and Miami respectively. Their relative contributions were not large - only a few probes, a few percent of all queries - but it was a far from optimal choice.

Middle East
In the Middle East the arrival of a K-root node in Tehran is clearly visible in the RTT vs time graph (see Figure 9). Immediately following the node's deployment in April, the RTTs to k.root-servers.net come down significantly and see a much smaller spread.

Figure 9: Median RTTs from probes in the Middle East. Green points are answers from new servers.
Figure 10 shows that from the new K-root servers, the Tehran location is by far used most often. Two factors contribute to this:
- Two thirds of the probes in the Middle East that reached a new server are located in Iran
- Probes in Iran almost exclusively talk to the new K-root nodes in Tehran
During most of the month of September, the routes to the Tehran nodes were picked up by probes in India, Sri Lanka, Pakistan, Nepal and nine other countries. During this time about 30% of the queries from RIPE Atlas to the Tehran nodes were made by probes not located in Iran. As reported earlier by Dyn research and on RIPE Labs , this resulted in reduced performance of the K-root system for affected hosts. After 26 September RIPE Atlas detected virtually no use of the Tehran nodes by foreign probes. Only one probe in Dubai continued to reach those nodes of K-root in about 15% of its queries.

Western Europe
With existing K-root servers at the major Internet Exchanges in London, Amsterdam and Frankfurt, most probes did not switch to using a new location. Figure 11 shows roughly 20% reaching one of the new locations (dominantly Vienna, Prague, Zurich and Saint Petersburg) in the last week of October.

For probes that started to use one of these locations the signal is mixed. Comparing the RTT distribution for queries in October with those made in March, we see shifts to both lower and higher RTTs. This is understandable when we consider geographical locations of probes and distances to new servers. Vienna and Prague may be logical choices for probes in Austria and Eastern parts of Germany, but for probes further West several existing servers are closer and would make a better choice.
For example, for the Netherlands you would expect most probes in the country to use the global K-root instance in Amsterdam. However, during the month of October we find 87 out of 570 probes in the country reached a server in a new location instead of one in Amsterdam in at least 75% of the queries. As Figure 12 shows, for these probes the expansion of the K-root cluster resulted in a roughly 25ms increase in RTT.

Conclusion
The newly installed K-root nodes are a notable improvement for the Middle East, Russia, CIS and Eastern Europe. We do see some side effects, as a fraction of the probes reaches one of the new nodes where an existing node would be a (far) better choice. This is inevitable with anycasting: the BGP route selection mechanism does not necessarily result in the shortest physical path being selected. However, with 12 other root name servers in operation the impact of a sub-optimal choice of a K-root node is likely to be minimal for the root name server system as a whole. The benefits of bringing down the latencies to regions that used to be further away from a K-root name server outweigh the drawbacks of increasing the latencies to K-root for a small minority in other regions.


Comments 0
The comments section is closed for articles published more than a year ago. If you'd like to inform us of any issues, please contact us.