

Last year, in a series of two articles, we presented statistics on the number of RIPE NCC members and the resources distributed to our members. With twelve months passed, we revisit the topic and look at how things evolved in 2010.
Introduction
Last year, in a series of two articles, we presented statistics on the number of RIPE NCC members and the number resources distributed to our members. With twelve months passed, we revisit the topic and look at how things evolved in 2010.
Developments in membership
Figure 1 shows the age distribution of the RIPE NCC membership. As before, each bar represents the number of members (also known as Local Internet Registries or LIRs) who signed the contract to become a member in one specific quarter. Inside each bar, the different colors indicate the present status of membership: active (yellow), pending closure (orange) or closed (red). Growth continued to be strong in 2010. The number of members who signed up in the last quarter is almost as high as in the second quarter of 2008, before the start of the financial crisis. During the year 784 registries signed up. However, because of mergers and bad debts, a number of existing LIRs had to be closed. By year's end the net growth resulted in a total of 7167 active members.

Figure 1 - Age distribution of RIPE NCC membership
In the top 10 of countries, not much changed. Russia still has the largest number of members. France passed the Netherlands and is now 5th largest.

Figure 2 - Membership distribution per country and region
IPv6 Address Allocations
With unallocated IPv4 addresses nearing exhaustion, it was good to see the number of IPv6 allocations continued to grow exponentially in 2010. A total of 834 new allocations were made, compared to 554 in 2009. Figure 3 shows demand for IPv6 addresses was especially high in the last three months: 344 of the 834 allocations were made during this time.

Another good sign is the growth in the number of LIRs holding an IPv6 allocation. As Figure 4 shows, the percentage of the membership with one or more IPv6 allocations increased from 25% in 2009 to 35% in 2010. The bump of LIRs holding exactly 4 IPv6 allocations is an artefact of the evolution of IPv6 allocation policies: Initially, the minimum allocation size for IPv6 address space was a /35. Later this was raised to a /32. LIRs who had received a /35 under the old policy, are entitled to have their allocation expanded to a /32. This is implemented by giving these LIRs 3 additional allocations of size /35, /34 and /33 respectively. Together with the initial /35 allocation these aggregate to a single /32. If we exclude these pioneers, only a very small number of members hold more than one IPv6 allocation.

Figure 4 - Number of IPv6 allocations per member
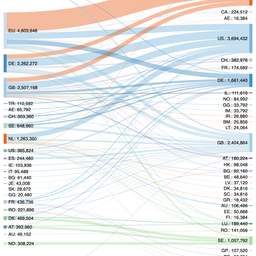
In terms of geographical distribution, the LIRs from Eastern Europe now account for a larger proportion of IPv6 allocations; their share went up from 22% in January 2010 to 25% in January 2011. However, in relation to the membership distribution (Figure 2), the region is still underrepresented in IPv6 allocations.

Figure 5 - IPv6 address allocations by region
IPv4 Address Allocations
Figure 6 shows the rate of IPv4 allocations continues to grow. Ever since 2002, there is an upwards trend in the number of IPv4 allocations per month. All-time highs were set first in November and then in December 2010. The news of IANA's unallocated pool dropping below 5% in October 2010 may have prompted a number of LIRs to speed up their requests for IPv4 address space.


Figure 7 - Allocated IPv4 addresses per month (in /8 equivalents)
IPv4 Address Assignments
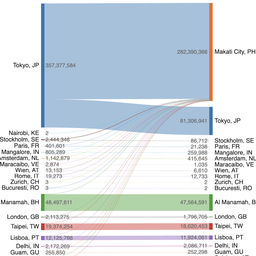
Last year we noted that, compared to the geographical distribution of the membership, Eastern European LIRs make more than the average number of direct IPv4 assignments to end users. This trend continued in 2010. Figure 8 shows how the individual assignments were distributed over the various countries on 1 January 2010 and on 1 January 2011. As we can see, Ukraine, Russia and Poland all passed the United Kingdom. 
Figure 8 - Distribution of direct IPv4 assignments
Like allocations, the number of IPv4 assignments per month shows, on average, a steady growth. But the peaks in November and December 2010 are not that much higher compared to the longer term trend.


Autonomous System numbers
In 2010 a total of 2437 Autonomous System (AS) numbers were assigned. 1854 of these were 16-bit, the other 583 were 32-bit AS numbers. To put that in perspective, we had a total of 21.025 AS numbers in the RIPE NCC registry on 1 January 2011, 810 of which were the new 32-bit ASN.
After a number of years of steady growth, assignment rates of AS numbers appear to be leveling off. Figure 11 shows wide fluctuations from month to month, but on a longer time scale these average out.

The rates of AS number assignments per month are at a similar level as the number of assignments per month. This does not come as a real surprise. End users who want to be multi-homed typically request both an AS number and a direct assignment from the same LIR. Figure 12 shows the distribution of the ratio between the number of ASNs and the number of IPv4 assignments for all LIRs who have made more than five direct assignments. The large peak near the value of 1 is a clear sign that most of these LIRs perform as many ASN as IPv4 assignments.

Figure 12 - Distribution Number of ASN per IPv4 assignment
Comments 0
The comments section is closed for articles published more than a year ago. If you'd like to inform us of any issues, please contact us.