
Together with Euro-IX we take a look at Internet Exchange Point (IXP) traffic levels during Felix Baumgartner's 39-kilometre jump to Earth, and we take a closer look at what exactly we can see at IXPs.
Introduction
The Red Bull Stratos project on 14 October 2012 saw Austrian skydiver Felix Baumgartner fly approximately 39 kilometres in a balloon before free falling and then parachuting to Earth, breaking the speed of sound as he did so. The event's timeline was as follows:
- 15:30 UTC: Balloon launch
- 18:07 UTC: Jump starts
- 18:17 UTC: Jump ends
This event was live-streamed over the Internet, and according to some sources it broke the record for the most watched online video event. Beyond figures and statistics, a fair indication of the event's popularity is that it has been deemed worthy of an enjoyable Lego re-creation .
We didn't do an analysis on the infrastructure that was used to deliver the data streams; online sources mostly point at a combination of Youtube and Akamai being used to deliver the live data streams to end users around the world.
What can we see at an IXP?
In earlier articles, we pointed out that not all traffic is going through IXPs and that we won't see statistics for traffic that is exchanged outside of the IXPs. We only see traffic levels on the public peering LAN of the IXP.
Because this can be non-intuitive, especially for non-operators, we want to elaborate a bit more here. In Figure 1, the bandwidth used by Network C to access content in Network B is counted in the IXP traffic statistics. The bandwidth used by Network A to access the same content is not, because there is a direct interconnection between Network A and Network B. In this case the operators of these networks chose to use that path to exchange traffic.

A phenomenon that reduces visible traffic levels during large-scale streaming events, such the Stratos event, are Content Delivery Networks (CDNs). The use of CDNs significantly reduces the amount of traffic sent across the Internet. If the CDN is in the same network as, or very close to, a large number of users, a heavy interest in specific content may not be visible in traffic level statistics, because only a relatively low bandwidth stream across the Internet is enough to feed this large number of users. This difference is shown schematically in Figure 2 below.

Each IXP is its own unique ecosystem of locally connecting networks that each can have intra-network CDN caches, so it's interesting to look at the various IXPs and see how traffic levels vary around high-profile events.
Traffic at IXPs during the Stratos jump
Similar to what we did during the sports events earlier this year (see a list of related articles at the bottom), we looked for different patterns in the IXP traffic from what is normally seen on a Sunday afternoon. What we observed at the three largest IXPs (DECIX Frankfurt, AMS-IX and LINX) was a slight drop of traffic levels between 18:00 and 18:15 UTC.
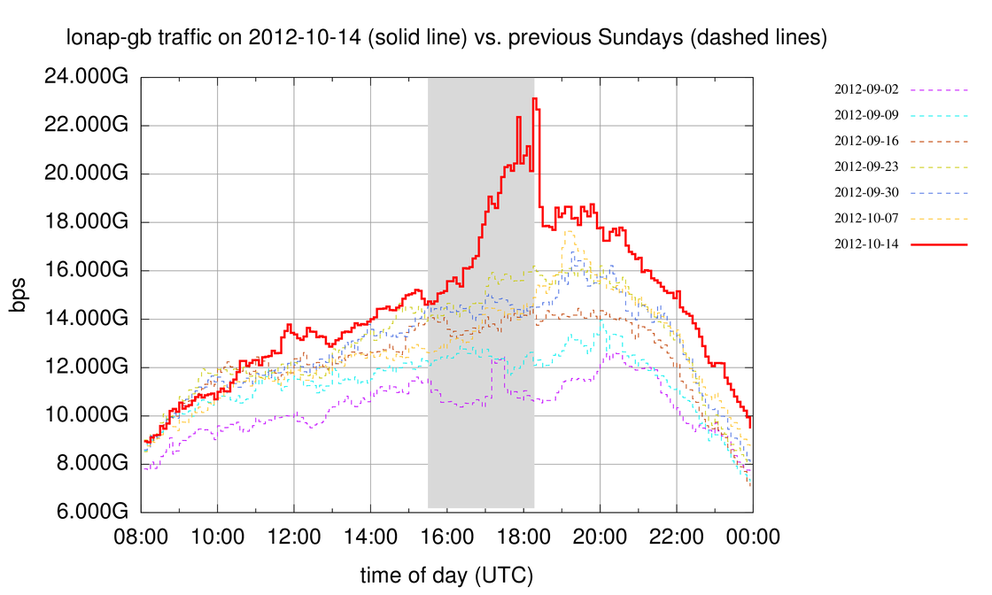
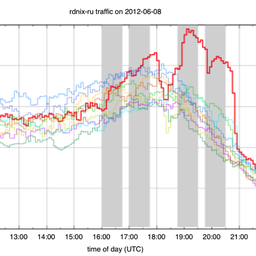
Other IXPs show dramatic increases of traffic correlated to the Stratos event. DECIX Hamburg (Germany), GigaPIX (Portugal), LONAP (UK) and VIX (Austria) all show increased traffic levels during the Stratos event. The VIX and LONAP stats are shown in Figure 3 and 4. The period between the launch of the balloon and the landing of Felix Baumgartner is marked by a grey background in all figures in this article. Both at VIX and LONAP, the traffic levels on 14 October start off normal, but they pick up after the balloon launch and, like Felix himself, stay abnormally high until about the time of the landing.


Some IXPs show a narrow peak right after the landing. This could be caused by people watching a non-live version of the event, for instance because their live stream didn't work as expected.
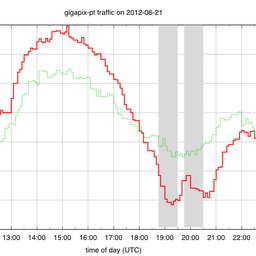
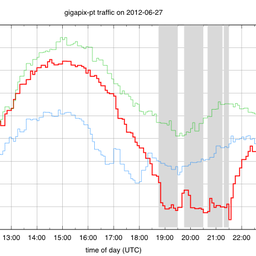
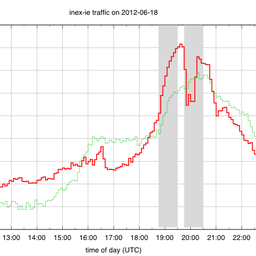
At some IXPs we see a distinct drop of traffic after the event, but traffic levels picking up again at around 19:00 UTC. An example of this is GigaPIX (Portugal), shown in Figure 5. It is currently unclear what exactly caused this, but it could be due to the Internet behaviour of users being more synchronised than normal due to the Stratos event. Think for instance about delaying dinner, or walking the dog, to watch this event.

If you are aware of anything that could have caused these distinct patterns in traffic levels at multiple IXPs in the hour after the Stratos event, please comment below.
All graphs are available on the RIPE NCC IXP Traffic page (Stratos jump) .
Thanks again to Euro-IX and all participating IXPs:


Comments 5
The comments section is closed for articles published more than a year ago. If you'd like to inform us of any issues, please contact us.
James Blessing •
Whilst the images used to describe what a CDN is and how it can potentially relieve the traffic see by an access network is true for certain types of CDN not all operate with hardware deployed deep inside the access network but operate in different models.
Mirjam Kühne •
Hi James. Thanks for your comment. We'll replace the image with a more generic one.
Mirjam Kühne •
We replaced the image to make it more generic. Please note that the intention is to show how CDNs reduce network traffic, not to prefer one CDN business model over another.
Simon Lockhart •
With reference to the dip after the jump, we saw exactly the same pattern on our Google PI, but not on any other external network link. My speculation on the cause of this is (rather than user behaviour) that Google had either artificially limited the amount of bandwidth available for their non-Felix content (to ensure sufficient capacity for Felix), or that they suffered some sort of failure in their serving platform - certainly I heard many reports of people having problems streaming content from Youtube.
JP Viljoen •
I wrote a (very) short blogpost about it as well soon after the jump, but was too tired to go find more stats. There's a graph snippet for JINX (ZA) and CAR-IX present, though: http://blog.froztbyte.net/2012/10/post-jump-things-everywhere-die/