
Easy BGP Monitoring with BGPalerter
• 9 min read
This is a brief tutorial that explains how to monitor BGP prefixes easily and effectively. For this purpose, we will use an open-source application named BGPalerter which is ready to go and requires almost no configuration. Currently, we use this solution at NTT, one of the largest global providers…


“It is wonderful for monitoring, but when I testing, it works with only Update messages and not permanently.”
Hello Alexey, Sorry but I don't understand your question (and your use case). For any help or further communication, please open an issue on the GitHub repository (https://github.com/nttgin/BGPalerter). Ciao, Massimo
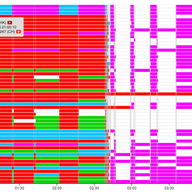
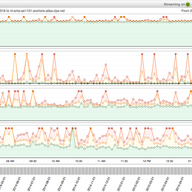
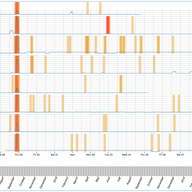
“I have a feature request: Implement two buttons to toggle the scale of the Y-Axis between "starting by the lowest value" (as it is now) or "starting by zero" and "ending by the highest value of that single graph" or "ending by the highest value of all graphs", please. This could help seeing geographical diversity in latency at a glance. Besides that: Great Work! *ThumbsUp”
Hello Frank, thanks for using LatencyMON! The min y (the 0 on the y-axis) is calculated based on ALL the charts, this removes from the y-axis the values which are the same for all the charts and leaves the different part intact. In fact, the Y-axis is always the same across all the charts. This serves exactly the purpose of allowing comparison at a glance!
“...please, also look at the link [1] to the DDoS attack on Dyn DNS. It not works well here. You must change with the right [2] one :-) __ [1]: https://labs.ripe.net/a-quick-look-at-the-attack-on-dyn [2]: https://labs.ripe.net/Members/massimo_candela/a-quick-look-at-the-attack-on-dyn Thanks&Regards, --sb.”
Thanks, fixed!
“Hi Massimo, Congrates to your Team and thanks for sharing. Just to look ahead, my question is this : if some Org wants to follow-up own' prefix|es (live), is it the appropriate tool to rely to ? Look, if someone want to be lively notified when a particular prefix is hijacked or a route is leaked, how to use your tool ? Regards, --sb.”
Hi Sylvain, The tool can be used for real-time monitoring (but it doesn't notify you automatically). The RIPEstat version is not enabled for real-time monitoring yet. The source code on GitHub includes already such feature (polling from API or WebSocket streaming). Tell me more about your use-case: would you use it directly from RIPEstat with real-time monitoring or you want to integrate it in a dashboard you already have and use your own data? Thanks Ciao, Massimo
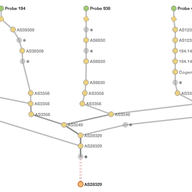
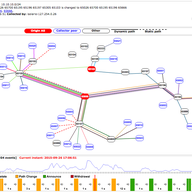
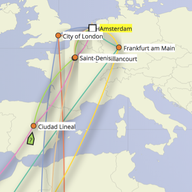
“How one can use TraceMon on windows.im not seeing any exe file.”
TraceMON is a web application you can run in your browser without any third-party plug-in. The operative system doesn't matter. It supports Chrome, Firefox, Safari, Edge. It doesn't support Internet Explorer. For now, the only traceroute datasource is RIPE Atlas (https://atlas.ripe.net/). You can create a measurement on RIPE Atlas and by clicking on the tab "TraceMON" you will see the results.
Hi Daniel, Thank you for your feedback! I have already something for the hop limit, but I have to improve the visualisation because I would like to preserve the probes in the graph (so I have to show that there are hops missing between the probe and the "first" hop). I saved the other suggestions in my ticket queue. Ciao, Massimo
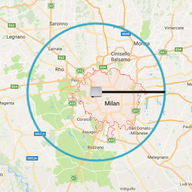
I received some questions about the exact location of the tool. This is now clarified in the text (above Figure 1). If you have any more questions, please let us know.
Showing 7 comment(s)