

IPv6 growth continues apace; content networks regularly measure more than 20% of their requests as taking place over IPv6 today. However, deployment has not been uniform. In this article, we review growth from the perspective of RIPE Atlas data since the launch event.
Six years since the Internet Society's coordinated IPv6 launch event, we continue to hear good noises about IPv6 deployment. ISOC, Google, Facebook, Cisco, APNIC, and Eric Vyncke all publish statistics that indicate IPv6 deployment is happening around the world.
What is very consistent by now is that the eyeball networks are pretty well-connected to the content networks, in general indicating IPv6 dailies around 20%. But enabling HTTP(S) is one thing; enabling IPv6 on other services and then building testing and monitoring around it is another.
At the RIPE NCC, we of course have various ongoing IPv6 efforts, including multiple IPv6 training courses, IPv6 RIPEness scoring, today's RIPE NCC::EDUCA IPv6 day, hackathons, a whole raft of IPv6 measurements you can run on RIPE Atlas (yes, you!), and the ongoing dual-stack operations of the K-root service.
The latter two are what I'm going to take a look at in this article: these are operational services that attract user traffic, one way or another. We're interested in the changes they show over the last few years.
RIPE Atlas
RIPE Atlas was officially launched on 15 November 2010. Today, we're running measurements from a little over 10,000 connected probes hosted within thousands of networks. Let's review how that has changed over the years.
IPv6 Expansion
If IPv6 deployment has grown as the content networks suggest, we may also expect to see a similar trend in IPv6 connectivity on the fleet of RIPE Atlas probes. We have a pretty stable base of connected probes; this graph shows the growth of the platform in terms of those with with IPv4, and those with IPv6:

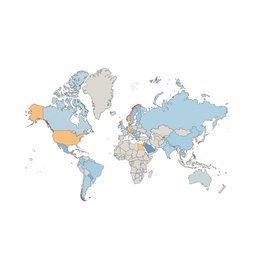
We can see that the number of IPv6-enabled probes is rising, which is great, though maybe not at the rate that content networks might suggest. In 2014, around 1,500 probes (22% of the fleet at that point) had IPv6, and today closer to 3,800 probes (38%) have IPv6.
We must, however, take into account that our probes are primarily based within the RIPE region, and secondarily in North America, where there are various ISPs with mature IPv6 deployments. The number of nodes with IPv6 on RIPE Atlas may just as indicative of the volunteer-based nature of the programme: there's likely a strong correlation between people who host RIPE Atlas probes, and people who care about buying IPv6 connectivity! It's important to note that RIPE Atlas is still ahead of the IPv6 curve, and that means that we have extremely good availability when it comes to measuring it.
Measurement of the IPv6 Network
A growing platform is one thing, but do people use it? Does the increasing IPv6 adoption imply more IPv6 measurements? It should, if we assume that people either have operational services they care about or are in the business of conducting measurement studies. Let's take a look at the data.
One way of thinking about this is the number of measurements being run on the platform over IPv4 versus IPv6. First, some terminology: here, we don't mean a measurement to mean "one traceroute", for example; we mean a measurement as a specification on the RIPE Atlas platform. One "measurement" may measure a target from one or many probes, one or more times.
To help answer this question, I pulled out the number of measurements that returned any data for the first day of each month going back as far as we have data. For this, I've ignored all long-running, built-in measurements, of which there is only a small set anyway. What I have not discounted is anchoring measurements, but if I did, I'd get a step closer to a real answer on user behaviour.
The major measurements that most people run are pings, traceroutes, and DNS queries; I pulled the data out for each of these, and here show the percentage of running measurements for each measurement type over time:

Remember, it says nothing about the volume of network traffic generated or the number of probes measured from. We see the ping and traceroute measurements move around pretty freely: on days where a disproportionate number of IPv4 or IPv6 measurements are running, of course the percentage of either is affected. The most obvious thing is the lack of a discernible trend. Perhaps people really are using the platform to measure IPv6 and IPv4, in the average case, and the outliers are larger scale studies, possibly research studies. The real question is why don't we see bursts of IPv6 measurements going past. It's possible that no orchestrated studies took place happened on the days shown above; we'll dig deeper into what we see here.
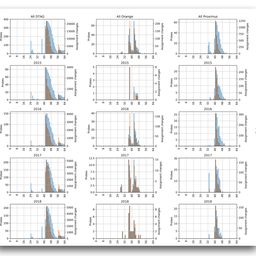
What's interesting, perhaps, is that we see most consistently 40% of the measurements using a DNS resolver over IPv6; this may be a side-effect of the measurement type, where in many cases folks will simply query the resolver provided by the local network and are more interested in the response from the service. Regarding the DNS measurements, the vast majority of DNS measurements scheduled on the platform are for TXT and SOA records. It's still interesting to consider the number of A or AAAA queries scheduled though:

Note - that's a log scale on the y-axis! So it's clear that while we have many DNS measurement campaigns that happen to use an IPv6 resolver, they're not actually attempting to directly resolve AAAA records at nearly the same frequency as they are A records. Indeed, it appears that large scale measurement campaigns are common, but on IPv6 they appear to be incredibly rare.
This merely scratches the surface. For one thing, this is only the first day of each month. For another, this doesn't enumerate the number of targets: multiple measurement campaigns to 8.8.8.8 or 1.1.1.1 (for example) will be counted multiple times. If so, perhaps there is, after all, some merit in IP addresses that people can remember? This deserves further study, and we will dig deeper.
K-Root
We publish rolling IPv6 stats for the k-root already. Historic high-level counts are available as RSSAC02 stats. Here, let's take the long-term view of a couple of aspects related to K-root traffic.
IPv6 Expansion
As we know, the CDNs report continuous IPv6 growth. On the K-root, we receive traffic mostly from other DNS resolvers, and this traffic is very different to web traffic. Do we see IPv6 deployment from those resolvers on the K-root? The short answer is that, yes, we do see IPv6 growth! What we measure is perhaps not as high as the daily peaks on some content networks, but also the K-root is perhaps a more universal platform than some web services.

In percentage terms, as of today we're consistently handling over 15% of queries over IPv6:

A deeper look on the growth cycles may be necessary, but at first glance this pattern doesn't appear to exhibit the S-curve deployment pattern we tend to see in annual cycles on content networks. That may not be surprising: it's one thing to enable IPv6 to a customer premises; it's another thing to work on their resolvers to operate over IPv6. Different teams, different priorities.
Query types
So, the number of networks running IPv6 resolvers is on the rise. That's good news! The last few years have seen a real drive towards the expansion of IPv6 content, IPv6 services, and IPv6 app support. Network engineers, browser vendors, application developers, and others alike have put in a lot of work to work on their IPv6 support.
Does this translate into differences in the queries seen on the K-root? Has the expansion of IPv6, and other factors such as Apple's IPv6 requirements for apps, influenced how many AAAA records are being requested versus A records? As platforms, browsers, networks etc. have matured their IPv6 support, has the number of AAAA queries changed?
Here's the absolute query volume broken down by query type:

Taking a look at this graph, it doesn't look much like AAAA queries are racing to catch up with A queries. Indeed, a fully equal network would query these with effectively 1:1 parity, but that's obviously not the case. The ratio of A to AAAA records looks more like this:

That is, on a given date, if I have 1000 A queries, I'd expect to receive AAAA queries at around 30% that rate. That's been more or less constant.
This isn't the full story, however. Most queries today may still be for A records, followed by AAAA records. But the network layer available affects aspects of behaviour too:

To read this graph, this is the percentage of queries per type delivered over IPv6. So from all of the AAAA queries, over 25% and often more are consistently delivered over IPv6. We're not entirely sure why this is.
Finally, we do still receive A6 queries! Obviously only in tiny volumes (~0.1% of AAAA queries). It's a fun reminder that nothing released onto the wilderness that the Internet is ever dies. We're not the first to observe it; but it's fun to see it here.
Summary
IPv6 growth is happening, and the volume of IPv6 traffic is operationally important. The K-root data indicates that not only web traffic but other core services do run serious deployments. This data deserves further study: how networks deploy IPv6 is not uniform, and understanding that there is DNS activity even in places where web traffic is not yet present may indicate forward movement on IPv6 rollouts.
Finally, pings and traceroutes are basic but fundamental parts of a networkers toolkit, and we use them all the time to monitor services, even when (or, especially if?) that service is a third-party hosting company or a CDN. But apparently our usage of them over IPv6 on RIPE Atlas is steady, at best. To make more sense of this data, a deeper dive into these trends may be warranted, but it's important to remember to also conduct IPv6 measurements if you're using RIPE Atlas for operational purposes or research purposes.

Comments 0
The comments section is closed for articles published more than a year ago. If you'd like to inform us of any issues, please contact us.