Internet Access Disruption In The Gambia - 2016

• 4 min read
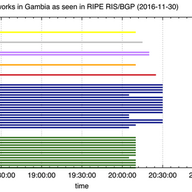
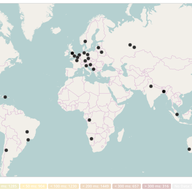
We had a look at various RIPE NCC data sets to see what we can learn from yet another country-wide Internet outage in 2016.

Based in Amsterdam, NL
Articles
Likes on articles
I'm a data scientist at the RIPE NCC. I'm a chemist by training, but have been working since 1998 on Internet related things, as a sysadmin, security consultant, web developer and researcher. I am interested in technology changes (like IPv6 deployment), Internet measurement, data analysis, data visualisation, sustainability and security. I'd like to bring research and operations closer together, ie. do research that is operationally relevant. When I'm not working I like to make music (electric guitar, bass and drums), do sports (swimming, (inline) skating, bouldering, soccer), and try to be a good parent.
• 4 min read
We had a look at various RIPE NCC data sets to see what we can learn from yet another country-wide Internet outage in 2016.
• 11 min read
Large BGP Communities are an addition to BGP that solves a communication problem between networks that want to use 32-bit AS Numbers. We measured how Large BGP Communities behave "in the wild" and if they create any problems.

• 8 min read
With the attempted coup in Turkey, reports went out about social media being throttled and/or blocked. We analysed data about this that we collected with RIPE Atlas and the Open Observatory of Network Interference (OONI).
• 5 min read
I attended a conference on Broadband Services and Infrastructure Mapping, which I think had some interesting content for RIPE Labs readers.
• 9 min read
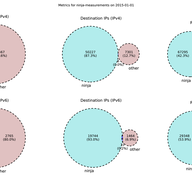
RIPE Atlas collects a lot of measurements. But how much of the Internet are we actually measuring? We had a sense that with a limited amount of extra load on the system, we could dramatically increase the number of router IPs seen on a given day in RIPE Atlas - and that means measuring more of the …
• 11 min read
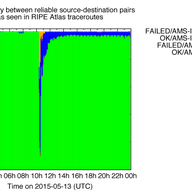
The Internet has a robust infrastructure that was designed to route around damage. But how well does it do this? We use RIPE Atlas to look at how large-scale disruptions in the Internet's core infrastructure affect end-to-end connectivity on the Internet.

• 11 min read
When operators and researchers use data from BGP route collectors such as RIS and Route Views, it's not easy to tell if a path announced to a collector is an ISP's customer cone, an internal route, or one learned from peering or transit. In this post we look at what information we can currently get…
• 11 min read
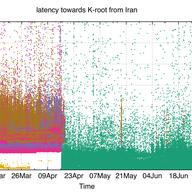
Dyn Research published an article on K-root recently. Here we would like to augment the picture with data from RIPE Atlas in order to provide a more complete picture of the effect of the K-root node in Iran.
• 8 min read
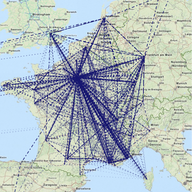
This article describes our recent collaborations with France-IX on collecting data plane and control plane Internet data with RIPE Atlas and the RIPE NCC's Routing Information Service (RIS).
• 6 min read
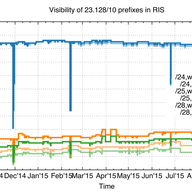
In October 2014 we started announcing a few longer-than-/24 prefixes and determined they were not very visible according to the Routing Information Service (RIS) and RIPE Atlas measurements. Now, almost a year later, we revisit this.


“Thank you for this, Emil and Alun! From looking at the map you provided, it would be great to see an additional anchor in Katthammarsvik. Do you think it's worth trying to add one there?”
Thanks for the suggestion. I think that depends on the physical (cables) and logical (routing) topology near Katthammarsvik in relation to the cable landing there. In a quick search I didn't find datacentres there, which makes me think it would not be too useful. Experts on the local Internet infrastructure would probably be able to answer if it would make sense or not.
This RIPE Labs article has good information on how to avoid effects from unknown attributes showing up at your BGP routers: https://labs.ripe.net/author/berislav_todorovic/bgp-path-attribute-filtering-a-powerful-tool-to-mitigate-alien-attributes/
“Hi Emile, I remember attribute 28 showing up in several previous studies. Interesting to see it causing a problem this time! As bgpdump maintainer, I'd ask you to check out v1.6.2 or higher, since 2020 there is a '-u' flag to output unknown attributes in the short (-m) mode (helpfully submitted by Italo Cunha) - it may make your future parsing life much easier :) Kind regards, Colin”
Thanks Colin, I didn't know, and this would have speeded up my analysis if I had!
Code for looking into AS Adjacency changes is available here: https://github.com/emileaben/as-neighbour-diff
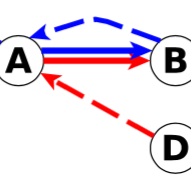
Code on how to create graphs like Figure 1 ( ie. BGP view of how networks in a country interconnect ) is available here: https://github.com/InternetHealthReport/country-as-hegemony-viz
NOG Alliance is helping out network operators in Ukraine: https://nogalliance.org/our-task-forces/keep-ukraine-connected/
An effort related to keeping Urkanian servers/websites online by the Dutch Cloud Community: https://dutchcloudcommunity.nl/community/cloud4ukraine/
We got a request for the HHI scores for other countries. I've put these in a small repo on github together with the code that generated this. repo: https://github.com/emileaben/hhi-eyeballs HHI scores for 2022-03-07 are available here: https://raw.githubusercontent.com/emileaben/hhi-eyeballs/main/eyeball-hhi.2022-03-07.csv
“This is awesome work, thank you! Do you maybe have the script/notebooks/sources to reproduce this? This could be potential used for other countries.”
Hi Jenneth, The observable notebook we used for this is here: https://observablehq.com/@aguformoso/internet-outages-as-seen-by-ripe-atlas . It's a little rough around the edges, so it would be great if you could help improve it!
Thanks for your comment Maxime. I would love to see more analysis too, and the tool allows people to do this. Take for instance this thread on Twitter where Jason Livingood analyses the signals for the US: https://twitter.com/jlivingood/status/1245142990336688130 If others have analysis for specific countries they want to share it would be great to have them collected, for instance as comments to this RIPE Labs post!
Showing 18 comment(s)