About the author
I'm a data scientist at the RIPE NCC. I'm a chemist by training, but have been working since 1998 on Internet related things, as a sysadmin, security consultant, web developer and researcher. I am interested in technology changes (like IPv6 deployment), Internet measurement, data analysis, data visualisation, sustainability and security. I'd like to bring research and operations closer together, ie. do research that is operationally relevant. When I'm not working I like to make music (electric guitar, bass and drums), do sports (swimming, (inline) skating, bouldering, soccer), and try to be a good parent.


“One may assume that, if some people delayed the changes, other people rushed in to adapt the networks to the increased load? Both behaviour may explain why the change rate is more or less the same?”
I think it would be interesting to dig into this data deeper indeed. I looked at splitting this out per country a bit, but could try figure out if there are trends in the sets of ASNs in this timeseries. Would you be willing to look at this? My colleague Vesna is doing a virtual hackathon around Internet and Corona ( https://labs.ripe.net/Members/becha/hackathons-in-the-time-of-corona ), I'd love it if we could collaborate around this. Let me or Vesna know, or hop on to the conf calls, Mon 2pm UTC ( 3pm Paris timezone :) )
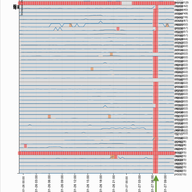
“Ghost routes: https://www.sixxs.net/tools/grh/what/”
I've added a reference to the different names 'stuck routes' and 'ghost routes' for this phenomenon at the beginning of the post. Thanks for the pointer!
“Interested in repeating this analysis for 2018 world cup?”
Hi Dan, we have no plans of repeating this analysis this time. This type of signal is still there, see for instance https://twitter.com/search?q=%40ohohlfeld%20%23worldcup&src=typd for a couple of graphs that show the impact in various places.
“@emileaben Rather than standardizing human-readable output format, why not emitting a standard structured format, separating the network part (traceroute) and the visualisation part (a tool using the structured output format). Such a format already exists, in RFC 5388. I let you do the same in JSON :-)”
thanks for the interest in the topic Stephane. You hit the nail on the head, the main idea was to standardise a structured format for traceroute. I notice a lack of enthusiasm for RFC5388, probably due to it's verbosity. quick test shows that gzip compression of RFC5388-style results would need 3x more storage relative to plain-text traceroute results. But the RFC is likely very useful to see if we cover all bases in a slimmer structured output format.
One other activity that may be worth mentioning here: We organised a get-together for traceroute implementers. As many traceroute implementations do things slightly different, a bit more coordination can help in making things more consistent, for instance in output formats.
“I'm trying to work with the ixp-jedi tool. In this step: ## measure.py This script runs one-off measurements for the probes specified in _probeset.json_ and stores their results in _measurementset.json_ This uses the RIPE Atlas measurement API for measurement creation, And it needs a valid measurement creation API key in ~ / .atlas / auth When trying to execute the script ./measure.py I get the following and I do not know how to solve it. Authentication file /root/.atlas/auth not found Please, I need your help.”
hi, thanks for trying to use the tool. i hope the docs on github are clear enough: https://github.com/emileaben/ixp-country-jedi/#measurepy --- This script runs one-off measurements for the probes specified in probeset.json and stores their results in measurementset.json This uses the RIPE Atlas measurement API for measurement creation, and it needs a valid measurement creation API key in ~/.atlas/auth . For more information on RIPE Atlas API keys see https://atlas.ripe.net/docs/keys/ --- if not let me know how to improve that. if you are interested in country-level monthy runs. these are available at: http://sg-pub.ripe.net/emile/ixp-country-jedi/history/
“Hi, Is there a way to download multiple days dataset without having to do them individually? Also do you have any API's which will permit me to download the datasets using wget?”
Hi Meenakshi, I think you'll have to download the files individually. I think, if your RIPE Access account doesn't have 2 factor authentication, you can use wget to download the files with the --user and --password options.
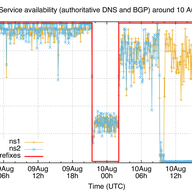
While we were busy pushing this post out, it looks like the Gambian Internet was restored, roughly around 12h UTC on 2 December. RIPE Atlas probes came online again, and we see 6 out of 7 ASNs in RIS data again.
Showing 18 comment(s)