
Interesting Graph - IPv6 Performance
• 2 min read
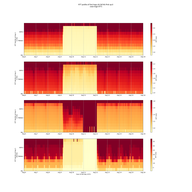
This graph shows IPv6 performance as measured to www.ripe.net. These measurements show performance of native IPv6 on average being very close to IPv4.

Based in Amsterdam, NL
Articles
Likes on articles
I'm a system architect/research coordinator at the RIPE NCC, where I work in the science group. I'm a chemist by training, but have been working since 1998 on Internet related things, as a sysadmin, security consultant, web developer and researcher. I am interested in technology changes (like IPv6 deployment), Internet measurement, data analysis, data visualisation, sustainability and security. I'd like to bring research and operations closer together, ie. do research that is operationally relevant. When I'm not working I like to make music (electric guitar, bass and drums), do sports (swimming, (inline) skating, bouldering, soccer), and try to be a good parent.
• 2 min read
This graph shows IPv6 performance as measured to www.ripe.net. These measurements show performance of native IPv6 on average being very close to IPv4.
• 4 min read
As a follow-up to the article IPv6 RIPEness of LIRs, we did more analysis based on LIR signup year, size and the industry sector that the LIR operates in.
• 1 min read
We measured the number of web clients connected to www.ripe.net during the RIPE 60 meeting in Prague. The results are shown in this graph.
• 1 min read
After creating a rating system, in which RIPE NCC members can get up to four “stars” for IPv6 services, depending on certain criteria, we now looked at the increase of IPv6 RIPEness over time. See this illustrated in this movie.
• 4 min read
There was a slight increase in the number of sources that issue priming queries to DNS root servers seen on 18 March 2010, right after the introduction of a signed .arpa zone. See here an analysis and some graphs.
• 1 min read
We have been measuring the number of clients connecting to www.ripe.net over IPv6 and made some interesting observations.
• 4 min read
The roll-out of a signed root-zone at K-root on 24 March 2010 was uneventful. But we saw the number of resolvers doing priming queries increase slightly since 18 March 2010 and wanted to find out why.
• 8 min read
In Part 1 and Part 2 of this article we showed various statistics on IPv6 measurements of web clients and caching resolvers. In this part we explain how the measurements were done.
• 13 min read
In Part 1 of this article we showed some statistics on IPv6 at end-users and at caching DNS resolvers. In this part will dig deeper into the data we collected and show details on mobile device use of IPv6, country- and city-level IPv6 deployment numbers, and AS-level statistics.
• 7 min read
It is important to keep an eye on how the IPv6 Internet develops. We wrote a script to measure the IPv4 capability, IPv6 capability and IPv4/IPv6 preference of end-users visiting our site. What is unique about this script is that it allows us also to measure the caching DNS resolver that the end-us…
• 11 min read
From 19-20 September, network operators, local IXPs, peering coordinators, Internet researchers and government officials will meet at CAPIF 2 to build a more diverse interconnection environment in Central Asia, Iran, and beyond. To prepare, we’ve been examining changes in local interconnection and …
• 6 min read
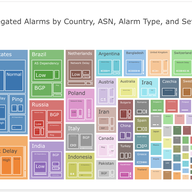
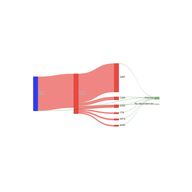
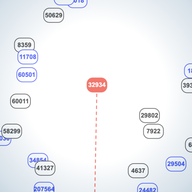
In this article, Mohamed presents his Google Summer of Code project that correlates and aggregates alarm data to detect real-world Internet outages. His project integrates data from IHR, GRIP, and IODA, visualising BGP hijacking, delays, and outages for improved real-time monitoring.

• 6 min read
In November 2021, Internet users from Mexico lost access to whatsapp.net and facebook.com. By the time the event was reported, the underlying problem had already gone unnoticed for quite some time. Here, we present key takeaways from our analysis of the event - carried out with RIPE Atlas - and we …
• 11 min read
This article presents a set of open-source tools - “reusable visualisations” - that extend the AS hegemony visualisations provided by the Internet Health Report. Users can directly use the online tools or embed the IHR data on their own posts, webpages, or Observable HQ notebooks.

• 11 min read
In this article we use data from RIPE Atlas probes to investigate the usage of 240/4, a block of IPv4 addresses 'reserved for future use', formally known as Class E in the wild.

• 6 min read
The events season has started! This article is an invitation to people from across many communities, whatever your role or level of experience, to come and participate in workshops, conferences, camps, lectures, festivals, and more.

• 11 min read
In 2021, reports emerged that hosts in Mexico were unable to reach whatsapp.net. It was determined that middleboxes were to blame, intercepting the queries to the root instance hosted in China and sending a bogus reply. This article investigates the prevalence of middleboxes using RIPE Atlas probes.

• 8 min read
The RIPE NCC recently held two Open House events to bring together people who help organise NOGs, which bring together people who help operate the Internet in particular parts the world.
• 4 min read
Following the Facebook outage that took place on 4 October, we saw people looking to BGPlay to get a better view of what went on. Here's a look at what the RIPEstat visualisation has to show us about the event in question.
• 7 min read
RIPE Atlas probes actively measure Internet connectivity through a variety of measurement types. In this article, we take a closer look at what probes can tell us about outages.


This RIPE Labs article has good information on how to avoid effects from unknown attributes showing up at your BGP routers: https://labs.ripe.net/author/berislav_todorovic/bgp-path-attribute-filtering-a-powerful-tool-to-mitigate-alien-attributes/
“Hi Emile, I remember attribute 28 showing up in several previous studies. Interesting to see it causing a problem this time! As bgpdump maintainer, I'd ask you to check out v1.6.2 or higher, since 2020 there is a '-u' flag to output unknown attributes in the short (-m) mode (helpfully submitted by Italo Cunha) - it may make your future parsing life much easier :) Kind regards, Colin”
Thanks Colin, I didn't know, and this would have speeded up my analysis if I had!
Code for looking into AS Adjacency changes is available here: https://github.com/emileaben/as-neighbour-diff
Code on how to create graphs like Figure 1 ( ie. BGP view of how networks in a country interconnect ) is available here: https://github.com/InternetHealthReport/country-as-hegemony-viz
NOG Alliance is helping out network operators in Ukraine: https://nogalliance.org/our-task-forces/keep-ukraine-connected/
An effort related to keeping Urkanian servers/websites online by the Dutch Cloud Community: https://dutchcloudcommunity.nl/community/cloud4ukraine/
We got a request for the HHI scores for other countries. I've put these in a small repo on github together with the code that generated this. repo: https://github.com/emileaben/hhi-eyeballs HHI scores for 2022-03-07 are available here: https://raw.githubusercontent.com/emileaben/hhi-eyeballs/main/eyeball-hhi.2022-03-07.csv
“This is awesome work, thank you! Do you maybe have the script/notebooks/sources to reproduce this? This could be potential used for other countries.”
Hi Jenneth, The observable notebook we used for this is here: https://observablehq.com/@aguformoso/internet-outages-as-seen-by-ripe-atlas . It's a little rough around the edges, so it would be great if you could help improve it!
Thanks for your comment Maxime. I would love to see more analysis too, and the tool allows people to do this. Take for instance this thread on Twitter where Jason Livingood analyses the signals for the US: https://twitter.com/jlivingood/status/1245142990336688130 If others have analysis for specific countries they want to share it would be great to have them collected, for instance as comments to this RIPE Labs post!
“One may assume that, if some people delayed the changes, other people rushed in to adapt the networks to the increased load? Both behaviour may explain why the change rate is more or less the same?”
I think it would be interesting to dig into this data deeper indeed. I looked at splitting this out per country a bit, but could try figure out if there are trends in the sets of ASNs in this timeseries. Would you be willing to look at this? My colleague Vesna is doing a virtual hackathon around Internet and Corona ( https://labs.ripe.net/Members/becha/hackathons-in-the-time-of-corona ), I'd love it if we could collaborate around this. Let me or Vesna know, or hop on to the conf calls, Mon 2pm UTC ( 3pm Paris timezone :) )
Showing 17 comment(s)