
Measuring World IPv6 Launch - Comparing IPv4 and IPv6 Performance

• 7 min read
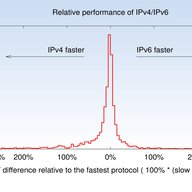
Following on from last year's during World IPv6 Day, we again looked at relative performance of IPv4 and IPv6 from the measurements we conducted. In this article we describe the methodology and the show the results of these measurements.


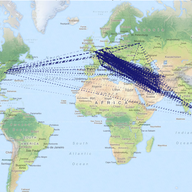

“Thank you for this, Emil and Alun! From looking at the map you provided, it would be great to see an additional anchor in Katthammarsvik. Do you think it's worth trying to add one there?”
Thanks for the suggestion. I think that depends on the physical (cables) and logical (routing) topology near Katthammarsvik in relation to the cable landing there. In a quick search I didn't find datacentres there, which makes me think it would not be too useful. Experts on the local Internet infrastructure would probably be able to answer if it would make sense or not.
This RIPE Labs article has good information on how to avoid effects from unknown attributes showing up at your BGP routers: https://labs.ripe.net/author/berislav_todorovic/bgp-path-attribute-filtering-a-powerful-tool-to-mitigate-alien-attributes/
“Hi Emile, I remember attribute 28 showing up in several previous studies. Interesting to see it causing a problem this time! As bgpdump maintainer, I'd ask you to check out v1.6.2 or higher, since 2020 there is a '-u' flag to output unknown attributes in the short (-m) mode (helpfully submitted by Italo Cunha) - it may make your future parsing life much easier :) Kind regards, Colin”
Thanks Colin, I didn't know, and this would have speeded up my analysis if I had!
Code for looking into AS Adjacency changes is available here: https://github.com/emileaben/as-neighbour-diff
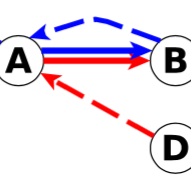
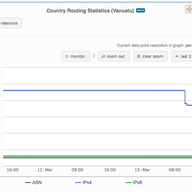
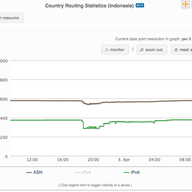
Code on how to create graphs like Figure 1 ( ie. BGP view of how networks in a country interconnect ) is available here: https://github.com/InternetHealthReport/country-as-hegemony-viz
NOG Alliance is helping out network operators in Ukraine: https://nogalliance.org/our-task-forces/keep-ukraine-connected/
An effort related to keeping Urkanian servers/websites online by the Dutch Cloud Community: https://dutchcloudcommunity.nl/community/cloud4ukraine/
We got a request for the HHI scores for other countries. I've put these in a small repo on github together with the code that generated this. repo: https://github.com/emileaben/hhi-eyeballs HHI scores for 2022-03-07 are available here: https://raw.githubusercontent.com/emileaben/hhi-eyeballs/main/eyeball-hhi.2022-03-07.csv
“This is awesome work, thank you! Do you maybe have the script/notebooks/sources to reproduce this? This could be potential used for other countries.”
Hi Jenneth, The observable notebook we used for this is here: https://observablehq.com/@aguformoso/internet-outages-as-seen-by-ripe-atlas . It's a little rough around the edges, so it would be great if you could help improve it!
Thanks for your comment Maxime. I would love to see more analysis too, and the tool allows people to do this. Take for instance this thread on Twitter where Jason Livingood analyses the signals for the US: https://twitter.com/jlivingood/status/1245142990336688130 If others have analysis for specific countries they want to share it would be great to have them collected, for instance as comments to this RIPE Labs post!
Showing 18 comment(s)