
IPv6 RIPEness - The List of 4-star LIRs

• 2 min read
Following up from the IPv6 RIPEness graphs we published earlier, those Local Internet Registries (LIRs) that fulfill all 4 IPv6 RIPEness criteria are now listed on the RIPE NCC web site.

Based in Amsterdam, NL
Articles
Likes on articles
I'm a data scientist at the RIPE NCC. I'm a chemist by training, but have been working since 1998 on Internet related things, as a sysadmin, security consultant, web developer and researcher. I am interested in technology changes (like IPv6 deployment), Internet measurement, data analysis, data visualisation, sustainability and security. I'd like to bring research and operations closer together, ie. do research that is operationally relevant. When I'm not working I like to make music (electric guitar, bass and drums), do sports (swimming, (inline) skating, bouldering, soccer), and try to be a good parent.
• 2 min read
Following up from the IPv6 RIPEness graphs we published earlier, those Local Internet Registries (LIRs) that fulfill all 4 IPv6 RIPEness criteria are now listed on the RIPE NCC web site.
• 3 min read
This infographic shows the percentage of networks (autonomous systems) that are IPv6 enabled from 2004 up until now. The interactive graph allows for comparison between IPv6 deployment in countries, and groups of countries.
• 2 min read
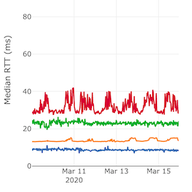
This graph shows IPv6 performance as measured to www.ripe.net. These measurements show performance of native IPv6 on average being very close to IPv4.
• 4 min read
As a follow-up to the article IPv6 RIPEness of LIRs, we did more analysis based on LIR signup year, size and the industry sector that the LIR operates in.
• 1 min read
We measured the number of web clients connected to www.ripe.net during the RIPE 60 meeting in Prague. The results are shown in this graph.
• 1 min read
After creating a rating system, in which RIPE NCC members can get up to four “stars” for IPv6 services, depending on certain criteria, we now looked at the increase of IPv6 RIPEness over time. See this illustrated in this movie.
• 4 min read
There was a slight increase in the number of sources that issue priming queries to DNS root servers seen on 18 March 2010, right after the introduction of a signed .arpa zone. See here an analysis and some graphs.
• 1 min read
We have been measuring the number of clients connecting to www.ripe.net over IPv6 and made some interesting observations.
• 4 min read
The roll-out of a signed root-zone at K-root on 24 March 2010 was uneventful. But we saw the number of resolvers doing priming queries increase slightly since 18 March 2010 and wanted to find out why.
• 13 min read
In Part 1 of this article we showed some statistics on IPv6 at end-users and at caching DNS resolvers. In this part will dig deeper into the data we collected and show details on mobile device use of IPv6, country- and city-level IPv6 deployment numbers, and AS-level statistics.


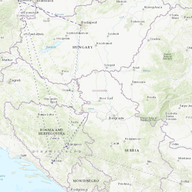


“Thank you for this, Emil and Alun! From looking at the map you provided, it would be great to see an additional anchor in Katthammarsvik. Do you think it's worth trying to add one there?”
Thanks for the suggestion. I think that depends on the physical (cables) and logical (routing) topology near Katthammarsvik in relation to the cable landing there. In a quick search I didn't find datacentres there, which makes me think it would not be too useful. Experts on the local Internet infrastructure would probably be able to answer if it would make sense or not.
This RIPE Labs article has good information on how to avoid effects from unknown attributes showing up at your BGP routers: https://labs.ripe.net/author/berislav_todorovic/bgp-path-attribute-filtering-a-powerful-tool-to-mitigate-alien-attributes/
“Hi Emile, I remember attribute 28 showing up in several previous studies. Interesting to see it causing a problem this time! As bgpdump maintainer, I'd ask you to check out v1.6.2 or higher, since 2020 there is a '-u' flag to output unknown attributes in the short (-m) mode (helpfully submitted by Italo Cunha) - it may make your future parsing life much easier :) Kind regards, Colin”
Thanks Colin, I didn't know, and this would have speeded up my analysis if I had!
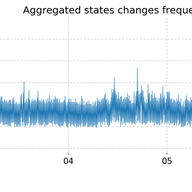
Code for looking into AS Adjacency changes is available here: https://github.com/emileaben/as-neighbour-diff
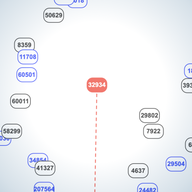
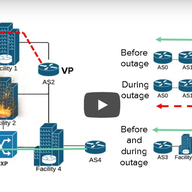
Code on how to create graphs like Figure 1 ( ie. BGP view of how networks in a country interconnect ) is available here: https://github.com/InternetHealthReport/country-as-hegemony-viz
NOG Alliance is helping out network operators in Ukraine: https://nogalliance.org/our-task-forces/keep-ukraine-connected/
An effort related to keeping Urkanian servers/websites online by the Dutch Cloud Community: https://dutchcloudcommunity.nl/community/cloud4ukraine/
We got a request for the HHI scores for other countries. I've put these in a small repo on github together with the code that generated this. repo: https://github.com/emileaben/hhi-eyeballs HHI scores for 2022-03-07 are available here: https://raw.githubusercontent.com/emileaben/hhi-eyeballs/main/eyeball-hhi.2022-03-07.csv
“This is awesome work, thank you! Do you maybe have the script/notebooks/sources to reproduce this? This could be potential used for other countries.”
Hi Jenneth, The observable notebook we used for this is here: https://observablehq.com/@aguformoso/internet-outages-as-seen-by-ripe-atlas . It's a little rough around the edges, so it would be great if you could help improve it!
Thanks for your comment Maxime. I would love to see more analysis too, and the tool allows people to do this. Take for instance this thread on Twitter where Jason Livingood analyses the signals for the US: https://twitter.com/jlivingood/status/1245142990336688130 If others have analysis for specific countries they want to share it would be great to have them collected, for instance as comments to this RIPE Labs post!
Showing 18 comment(s)