BGP Large Communities Uptake - An Update

• 4 min read
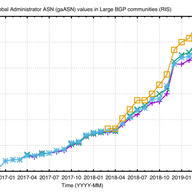
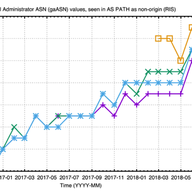
We were asked by the community to look at the uptake of BGP Large Communities as observed by our Routing Information Service (RIS).

Based in Amsterdam, NL
Articles
Likes on articles
I'm a data scientist at the RIPE NCC. I'm a chemist by training, but have been working since 1998 on Internet related things, as a sysadmin, security consultant, web developer and researcher. I am interested in technology changes (like IPv6 deployment), Internet measurement, data analysis, data visualisation, sustainability and security. I'd like to bring research and operations closer together, ie. do research that is operationally relevant. When I'm not working I like to make music (electric guitar, bass and drums), do sports (swimming, (inline) skating, bouldering, soccer), and try to be a good parent.
• 4 min read
We were asked by the community to look at the uptake of BGP Large Communities as observed by our Routing Information Service (RIS).
• 3 min read
Humans are pretty good at finding patterns in network measurements, but it can be difficult to automate this so one can process many time series at the same time. Now we have an expert in the house who can help us with this.
• 9 min read
In this article we look into the uptake of BGP Large Communities using the RIPE Routing Information Service (RIS).
• 5 min read
We're looking at user-to-user connections, based on RIPE Atlas measurements and ISP's end-user market share estimates provided by the APNIC.
• 6 min read
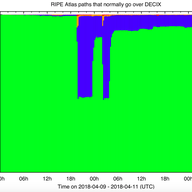
On the night of 9 April 2018, DE-CIX Frankfurt experienced an outage. As this is one of the largest Internet Exchange Points, this is an interesting case to study in more depth to see what we can learn about Internet robustness. We plan to update this article if new information/corrections flow in.
• 6 min read
Last week I attended the Passive and Active Measurement (PAM) conference in Berlin. In this article I present some highlights and take-aways.

• 6 min read
This year's Internet Measurement Conference (IMC) was held in London from 1 - 3 November. In this article we highlight some of the presented work that we think is interesting and that the RIPE community might find useful.
• 4 min read
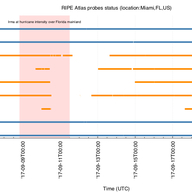
There are all kinds of reasons why RIPE Atlas probes might become disconnected. So, even though we'd like all probes to be connected all the time, disconnects can also tell us a useful story.
• 4 min read
We found a bug in a dataset that we've been producing for years.
• 8 min read
The RIPE NCC is operating K-root, one of the 13 DNS root servers. In this article we shed some light on the operational policies of K-root to clarify possible misunderstandings about how it is operated.
• 6 min read
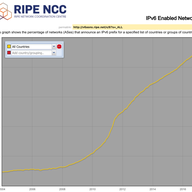
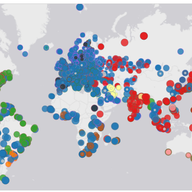
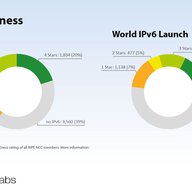
On the anniversary of the World IPv6 Launch, this article takes a look at the readiness of networks to deploy IPv6, using statistics from the RIPE NCC service region and beyond.
• 6 min read
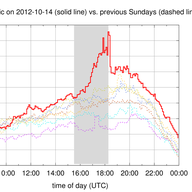
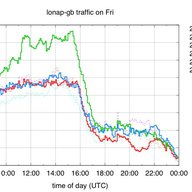
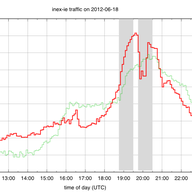
Together with Euro-IX we take a look at Internet Exchange Point (IXP) traffic levels during Felix Baumgartner's 39-kilometre jump to Earth, and we take a closer look at what exactly we can see at IXPs.
• 8 min read
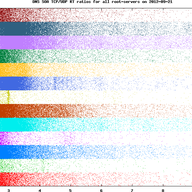
We did some measurements on the round-trip (RT) values of DNS queries for SOA (Start of Authority) records from our RIPE Atlas probes, over both UDP and TCP. We plotted the TCP/UDP ratios on graphs, and found that, as expected, for the majority of the measurements, it is around 2. However, we also …
• 3 min read
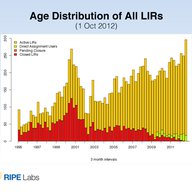
We observed an increase in the number of new LIRs in the RIPE NCC service region. Many of these new LIRs show 1-star IPv6 RIPEness.
• 10 min read
Following on from the European Championship earlier this year, we looked at changes in Internet traffic volume at Internet Exchange Points (IXPs) during the Olympics. This is a joint project with Euro-IX.

• 4 min read
Olympic fever didn't escape us here at the RIPE NCC!
• 1 min read
As part of our Data Repository, the RIPE NCC has released a new dataset. This dataset contains DNS lookups (A+AAAA), ping/ping6, traceroute/traceroute6 and HTTP fetches (IPv4/IPv6) from 53 vantage points (TTM, CAIDA Ark and others) to 60 websites involved in World IPv6 Launch. The data covers the p…
• 6 min read
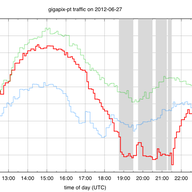
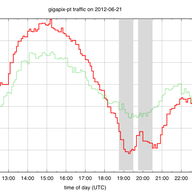
This is the last in a series of articles in which we look at traffic statistics at Internet Exchange Points during the European Championship 2012. This time we looked at IXP traffic during the semi-finals and the final. In addition we also look back over the entire 5 weeks of matches and draw some …
• 7 min read
This is the fourth in a series of articles in which we look at traffic statistics at Internet Exchange Points during the European Championship currently taking place. This time we looked at IXP traffic during the quarter-finals.
• 7 min read
This is the third in a series of articles in which we look at traffic statistics at Internet Exchange Points during the European Championship currently taking place.


“Thank you for this, Emil and Alun! From looking at the map you provided, it would be great to see an additional anchor in Katthammarsvik. Do you think it's worth trying to add one there?”
Thanks for the suggestion. I think that depends on the physical (cables) and logical (routing) topology near Katthammarsvik in relation to the cable landing there. In a quick search I didn't find datacentres there, which makes me think it would not be too useful. Experts on the local Internet infrastructure would probably be able to answer if it would make sense or not.
This RIPE Labs article has good information on how to avoid effects from unknown attributes showing up at your BGP routers: https://labs.ripe.net/author/berislav_todorovic/bgp-path-attribute-filtering-a-powerful-tool-to-mitigate-alien-attributes/
“Hi Emile, I remember attribute 28 showing up in several previous studies. Interesting to see it causing a problem this time! As bgpdump maintainer, I'd ask you to check out v1.6.2 or higher, since 2020 there is a '-u' flag to output unknown attributes in the short (-m) mode (helpfully submitted by Italo Cunha) - it may make your future parsing life much easier :) Kind regards, Colin”
Thanks Colin, I didn't know, and this would have speeded up my analysis if I had!
Code for looking into AS Adjacency changes is available here: https://github.com/emileaben/as-neighbour-diff
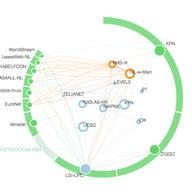
Code on how to create graphs like Figure 1 ( ie. BGP view of how networks in a country interconnect ) is available here: https://github.com/InternetHealthReport/country-as-hegemony-viz
NOG Alliance is helping out network operators in Ukraine: https://nogalliance.org/our-task-forces/keep-ukraine-connected/
An effort related to keeping Urkanian servers/websites online by the Dutch Cloud Community: https://dutchcloudcommunity.nl/community/cloud4ukraine/
We got a request for the HHI scores for other countries. I've put these in a small repo on github together with the code that generated this. repo: https://github.com/emileaben/hhi-eyeballs HHI scores for 2022-03-07 are available here: https://raw.githubusercontent.com/emileaben/hhi-eyeballs/main/eyeball-hhi.2022-03-07.csv
“This is awesome work, thank you! Do you maybe have the script/notebooks/sources to reproduce this? This could be potential used for other countries.”
Hi Jenneth, The observable notebook we used for this is here: https://observablehq.com/@aguformoso/internet-outages-as-seen-by-ripe-atlas . It's a little rough around the edges, so it would be great if you could help improve it!
Thanks for your comment Maxime. I would love to see more analysis too, and the tool allows people to do this. Take for instance this thread on Twitter where Jason Livingood analyses the signals for the US: https://twitter.com/jlivingood/status/1245142990336688130 If others have analysis for specific countries they want to share it would be great to have them collected, for instance as comments to this RIPE Labs post!
Showing 18 comment(s)